Figures & data
Figure 1. Carbon emissions in Nigeria from 1960 to 2020. Data source: (TealTool Citation2021).
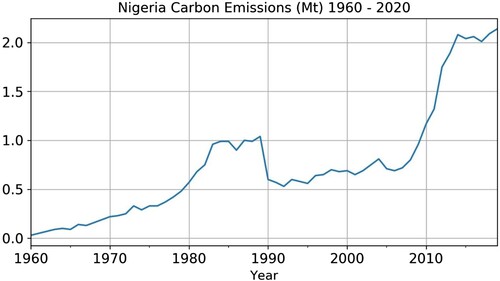
Figure 2. Conceptual framework of study (Source: Authors).
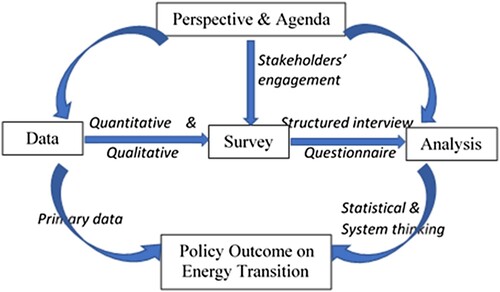
Figure 3. Framework approach to survey data collection (Source: Authors).
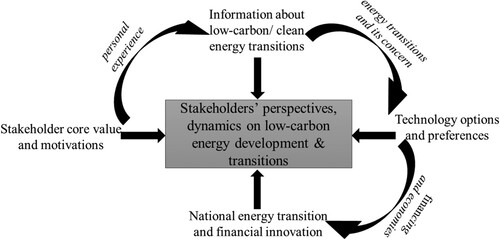
Table 1. Affiliations of the stakeholders (%).
Figure 4. Stakeholders’ area of interest in power sector.
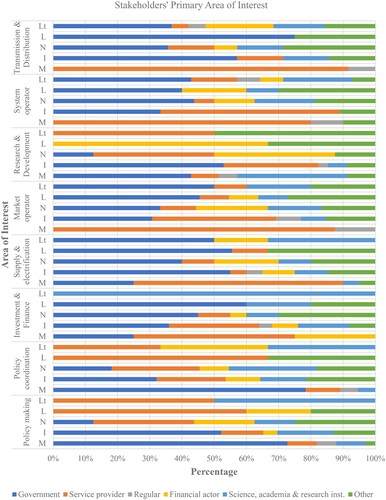
Figure 5. Stakeholders’ involvement in clean energy projects.
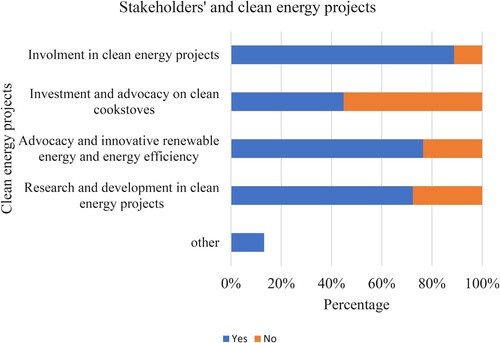
Table 2. Descriptive statistics on relevant tasks that describes energy transition.
Table 3. Descriptive statistics on the relevant concept to drive a low-carbon energy future for a successful energy transition.
Table 4. Descriptive statistics on the relevant concept to drive a low-carbon energy future.
Figure 6. Required technology to achieve SDGs 7 (2030) and AU 2063.

Figure 7. Technology to be invested in to enhance resilience against climate change impact.
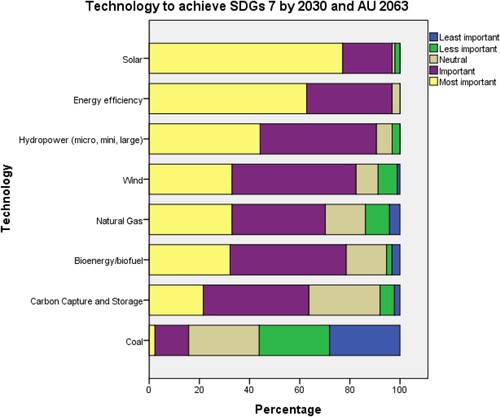
Figure 8. Evolution of technology in Nigeria.
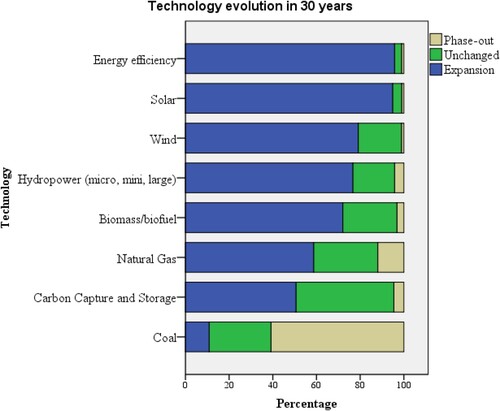
Figure 9. Attention giving to energy transition in the Nigeria national annual budget.
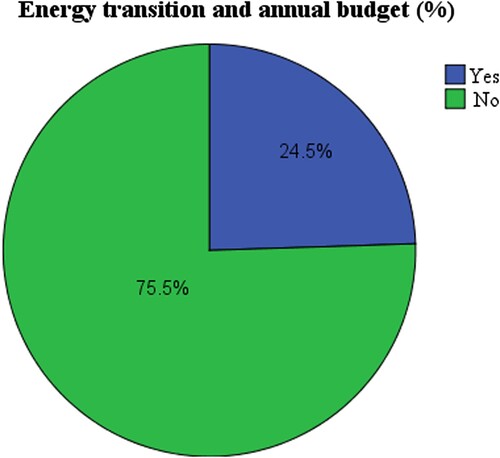
Figure 10. Innovation for low-carbon energy to support energy transition in Nigeria.
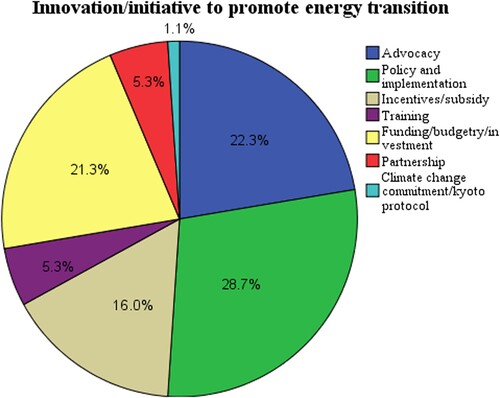
Figure 11. Financial innovations to enhance a low-carbon energy transition.
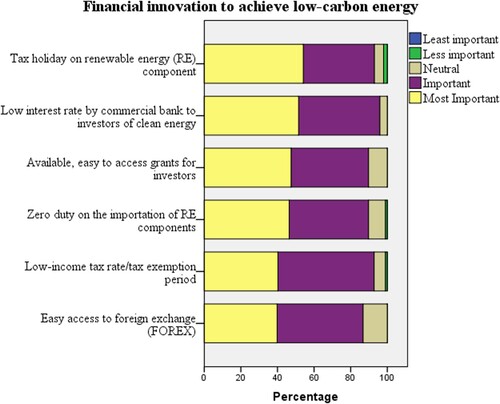
Figure 12. Selected drivers of a low-carbon energy future.
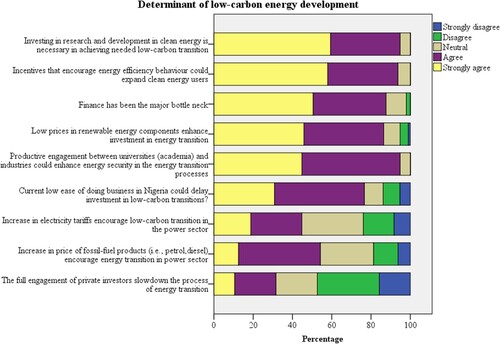
Figure 13. Wordcloud of frequent words used by respondents.
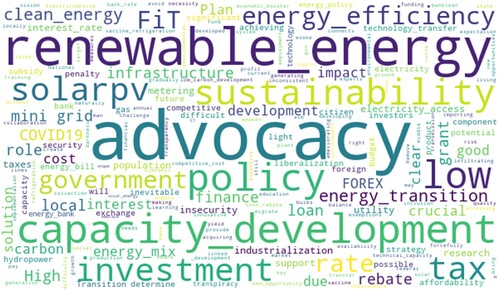
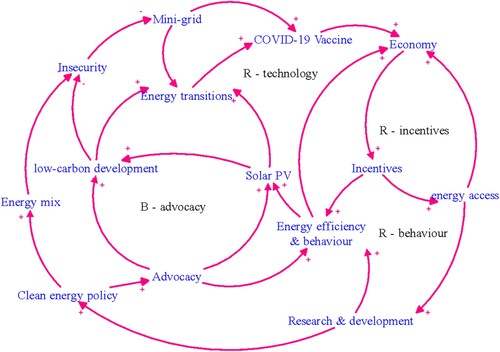
Figure 14. Causal loop diagram for national energy transitions.