
Figures & data
Figure 1. Solar-powered airship shape. Red for the calculated expected highest energy collection potential and blue for the calculated expected lowest energy collection potential.
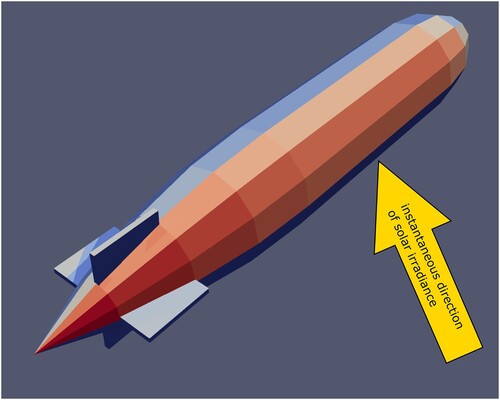
Table 1. Assumed maximal load and number of passengers depending on travel altitude based on conventional buoyant lift.
Table 2. Assumed maximal payload for the cargo use case.
Figure 2. Simulated travel route of a solar-powered airship.
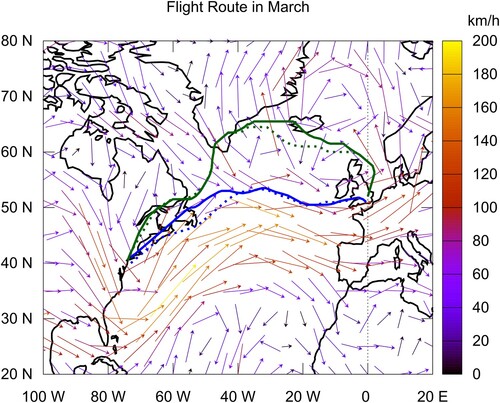
Figure 3. Simulated optimal flight altitude for travel in March between New York and London.
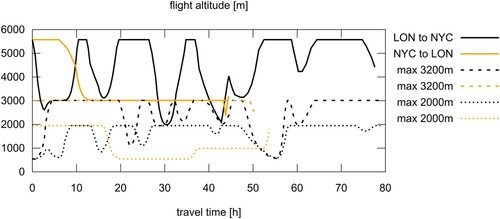
Figure 4. Battery charge level, engine power and power obtained by solar cells. Flight from London to New York in March. Maximal travel altitude 3200 m.
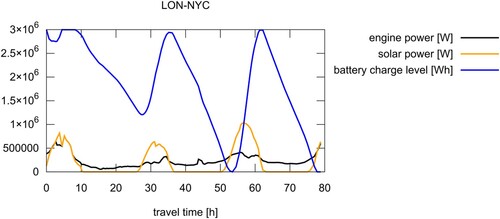
Figure 5. Battery charge level, engine power and power obtained by solar cells. Flight from New York to London in March. Maximal travel altitude 3200 m.
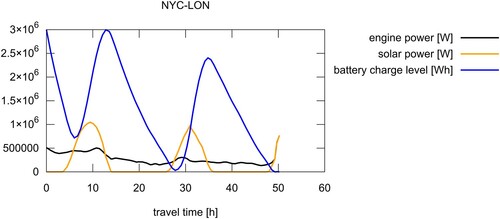
Figure 6. Simulated flight times of an airship depending on the month of the year 2019. Travel route between London (LON) and New York (NYC).
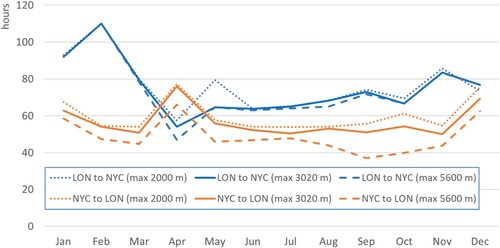
Figure 7. Simulated flight times of an airship depending on the month of the year 2019. Travel route between Gran Canaria (LPA) and Madrid (MAD).
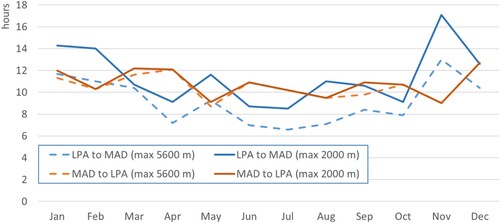
Figure 8. Simulated travel route of a solar-powered airship in January (winter, blue line), April (spring, green line), July (summer, orange line) and October (autumn, brown line), between New York and London (left) and London to New York (right). The maximal travel altitude is 3020 m.
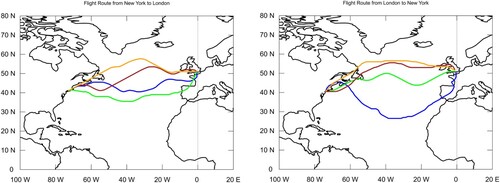
Figure 9. Simulated true air speed and speed over ground for a flight from London to New York. The wind speed is obtained from a database of the year 2019. Maximal travel altitude is 3020 m.
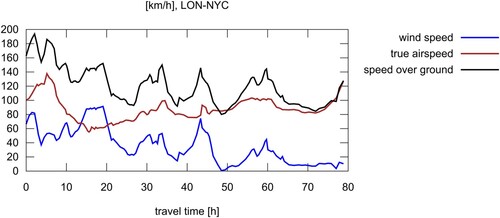
Figure 10. Simulated true air speed and speed over ground for a flight from New York to London in March. The wind speed is obtained from a database of the year 2019. Maximal travel altitude is 3020 m.
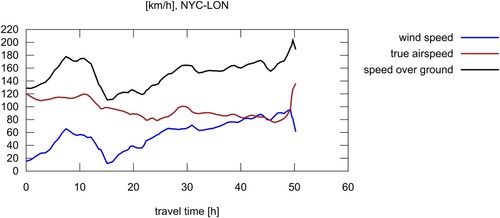
Table 3. Average travel times between New York (NYC)–London (LON) and Madrid (MAD)–Gran Canaria (LPA) by a solar-powered airship.
Figure 11. Outside hexagon parking space construction for a large number of airships for n = 2 triangles at each edge of the hexagon.
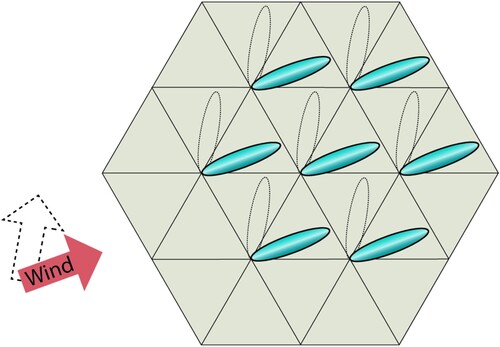
Figure 12. Parking in a hangar.
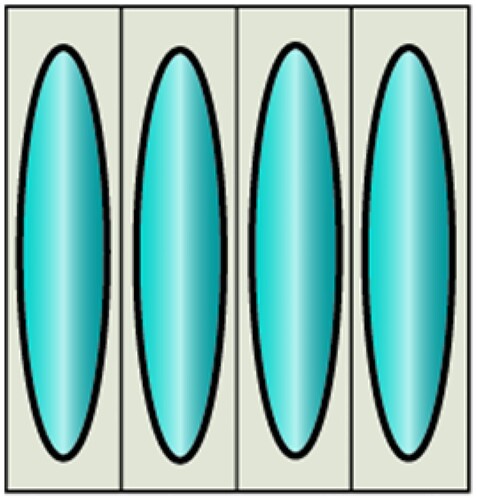
Table 4. Comparison of land use requirement for air transportation.
Table 5. Comparison of CO2 emission and land use for air transportation.
Table 6. Energy consumption prices for operating conventional aircraft and the solar-powered airship.
