Figures & data
Figure 1. Costs of wind turbine lifespan – adapted from Sathler (Citation2013).
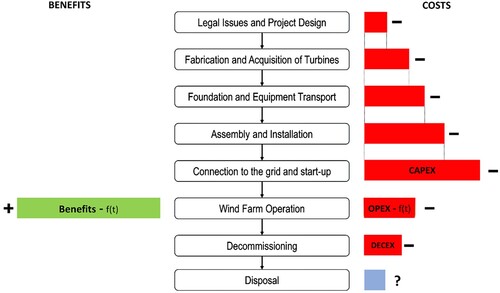
Figure 2. Comparison of two life cycle cost scenarios – Source: Adapted from Sakurai (Citation1997).
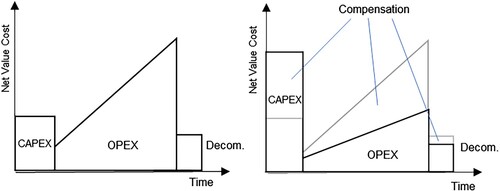
Figure 3. Six main losses.
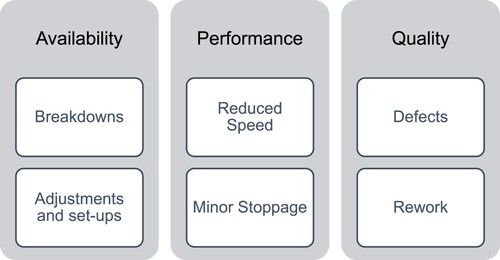
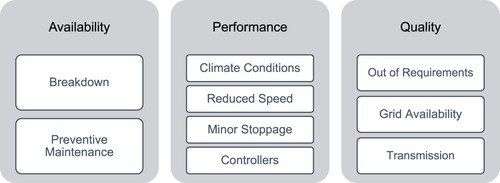
Figure 4. Flow chart losses in wind power according to OEE tool.
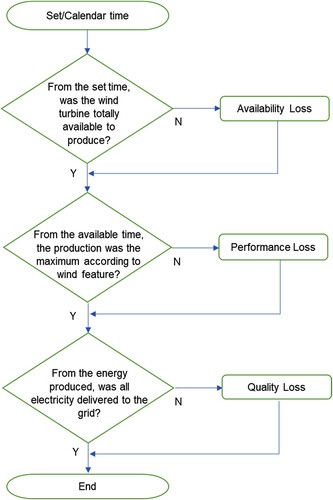
Table 1. Main cause of losses by availability of wind power.
Table 2. Main cause of losses by performance in wind power (*Not fully responsibility of operators **Only offshore deployments).
Table 3. Main causes of losses by quality in wind power (*Not fully the responsibility of operators).
Figure 5. Main operational losses in wind power.