Figures & data
Table 1. Determination of the physical and chemical properties of the raw oil.
Figure 1. Biodiesel Production from croton and castor oil (one-step process).
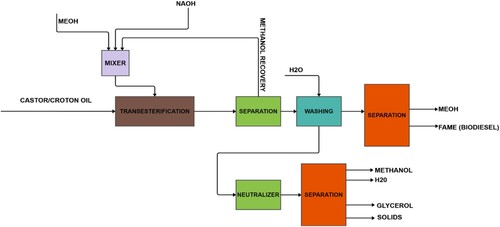
Figure 2. Biodiesel Production from Jatropha oil (two-step process).
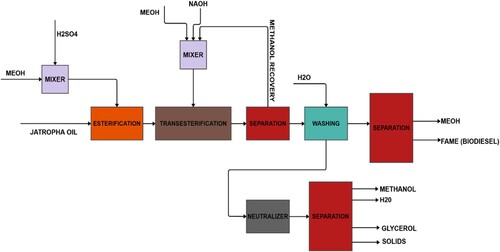
Table 2. Determination of the fuel properties of the biodiesel B100.
Table 3. Parameter values used in the analysis.
Table 4. Estimation of equipment costs.
Table 5. Estimation of Total Capital Investment
Table 6. Estimation of Total Operating Costs.
Table 7. Fatty acid profile for castor, croton, and jatropha oil.
Table 8. Characteristics of the oil.
Table 9. Physical and Chemical characteristics of the Biodiesel B100.
Table 10. Physical and chemical characteristics of the B10 blend.
Figure 3. Variation of acid value with Methanol: FFA mole ratio at sulphuric acid concentration of 3 wt% and 7%.
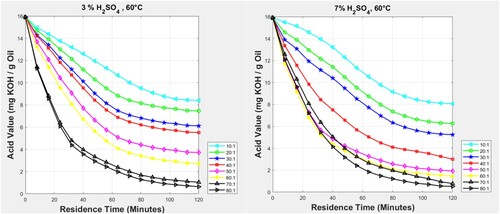
Figure 4. Variation of acid value with the temperature at sulphuric acid concentration of 3 wt% Methanol: FFA mole ratio of 70:1.
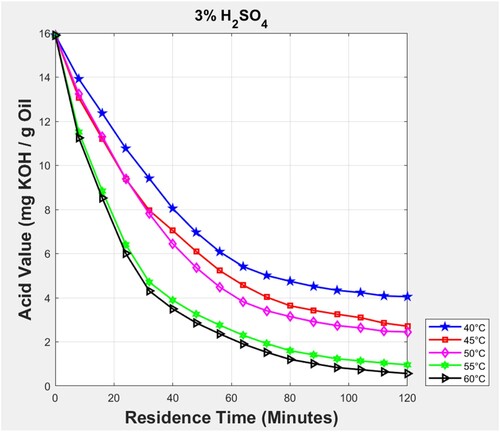
Figure 5. Effect of Methanol: Oil ratio.
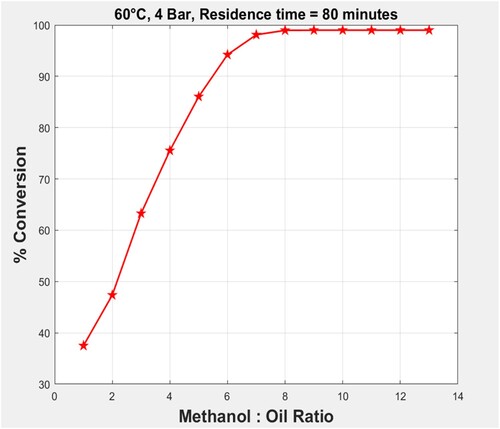
Figure 6. Effect of NaOH (alkali catalyst) concentration on percent conversion.
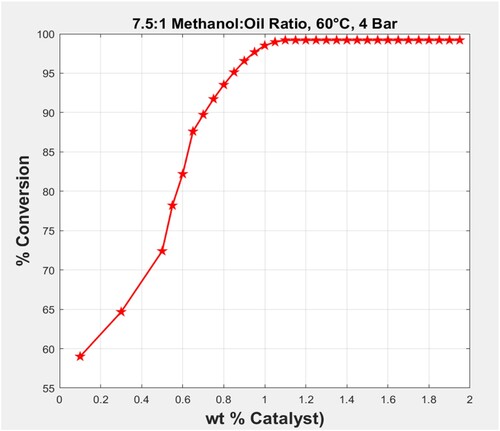
Figure 7. Effect of reaction temperature on percent conversion.
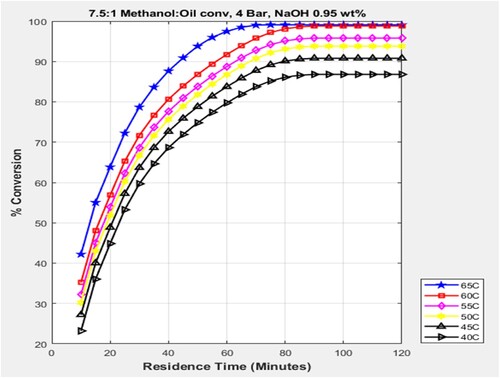
Figure 8. Net Present Value (NPV) of Biodiesel production from the different feedstocks.
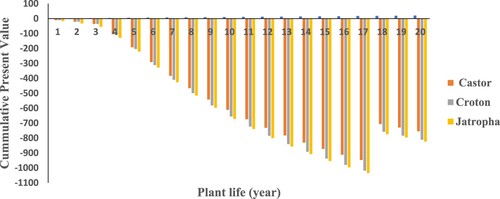
Figure 9. Effect of feedstock cost on NPV for the different feedstocks.
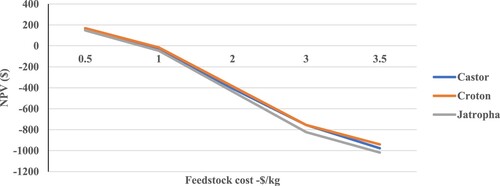
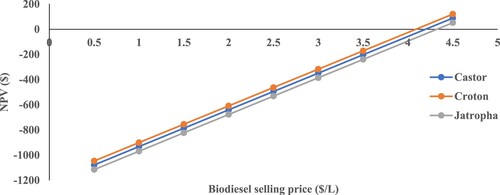
Figure 10. Effect of biodiesel price on NPV for the different feedstocks.