Figures & data
Table 1. A review of the conducted studies.
Figure 1. The flowchart of the proposed method.
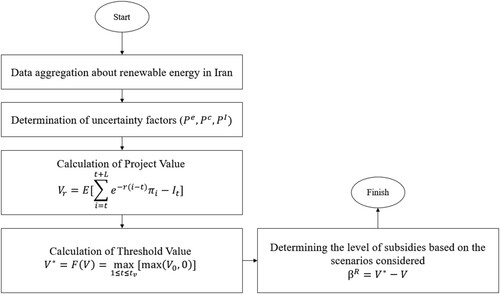
Table 2. Uncertainty factor parameters.
Table 3. Key technical and economic parameters of the project (https://www.satba.gov.ir/en/home).
Figure 2. Unit production capacity without considering carbon emissions.
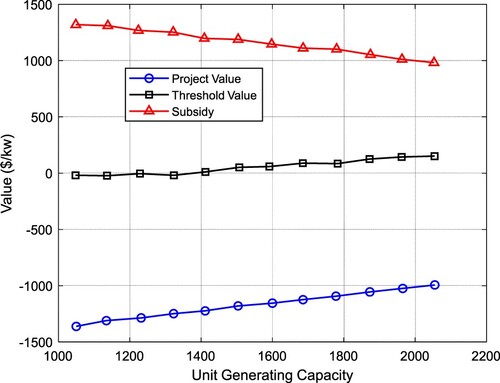
Figure 3. Unit generating capacity (with CO2 emission).
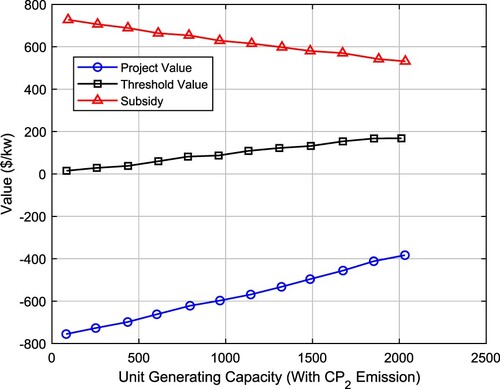
Figure 4. The impact of electricity market prices in a state without considering carbon emissions.
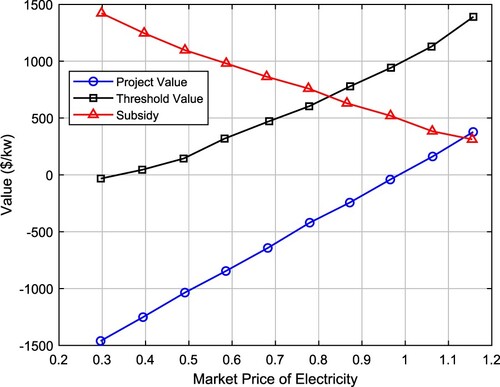
Figure 5. The impact of electricity market prices on carbon emission considerations.
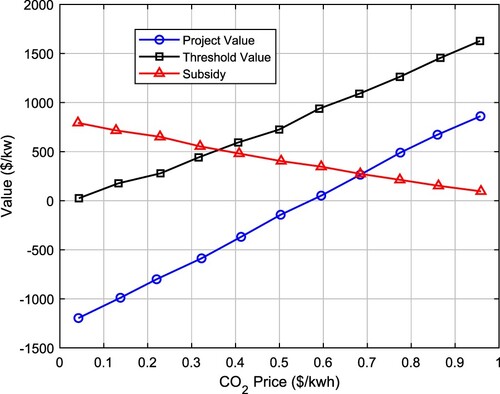
Figure 6. The impact of electricity market prices in the state without considering carbon emissions in the state of market price fluctuations.
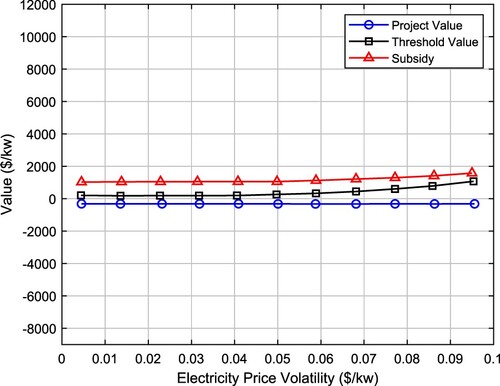
Figure 7. The effect of electricity market prices under the consideration of carbon emissions condition in the event of market price fluctuations.
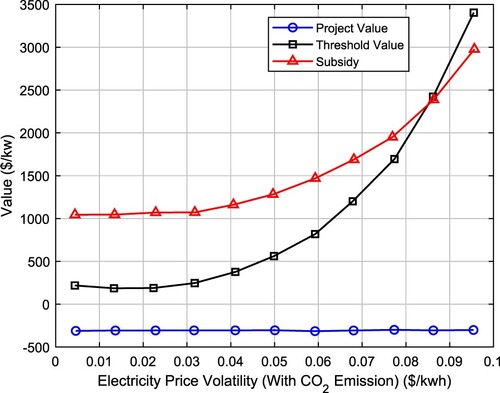
Figure 8. Impact of discount rate on subsidy amount, threshold and project value.
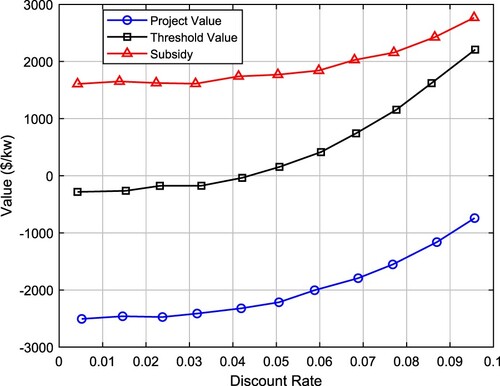
Figure 9. Impact of discount rate considering carbon emissions.
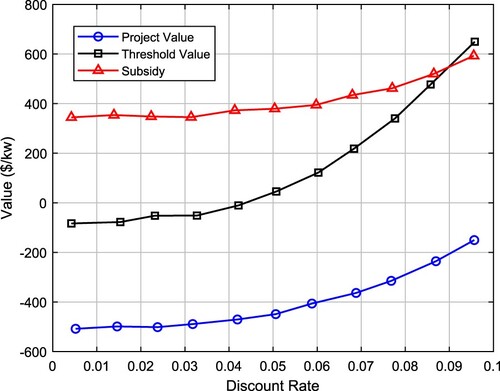
Figure 10. Impact of CO2 price fluctuations on subsidy amount, threshold and project value.
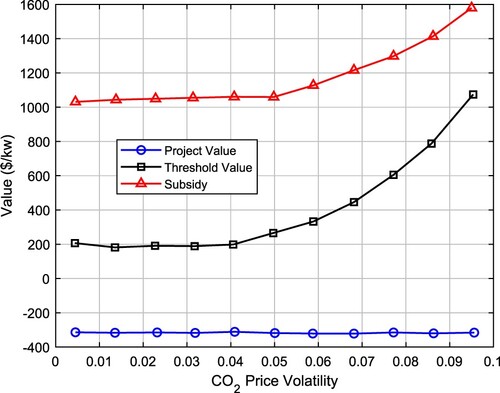
Figure 11. The impact of CO2 emission reduction price.
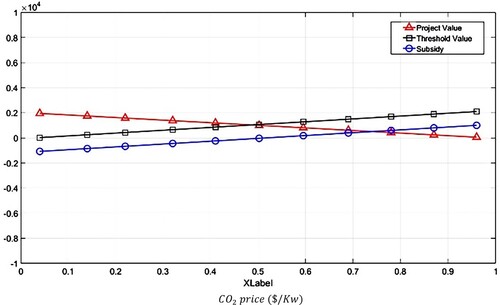
Figure 12. The effect of CO2 emission threshold value on the profitability of a company with a nominal production of 1 MW in Iran.
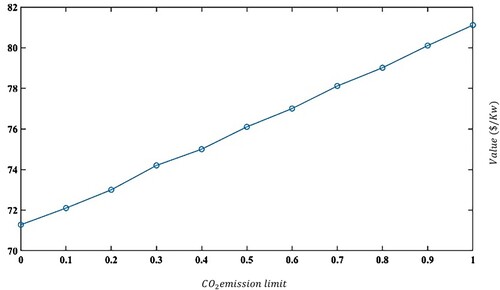
Table 4. Main results (dollars per kilowatt).
Table 5. The effect of uncertainty rate on model results.
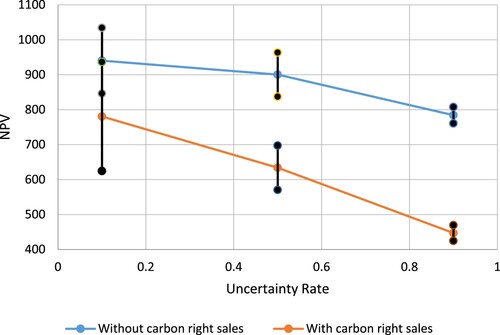
Figure 13. Changes in NPV and RO value of the project at different rates of uncertainty.
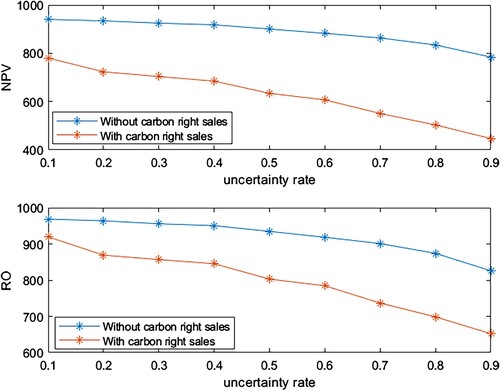
Figure 14. Standard deviation of robust box method in NPV results.