Figures & data
Figure 1. Electricity production in the world (IEA Citation2021).
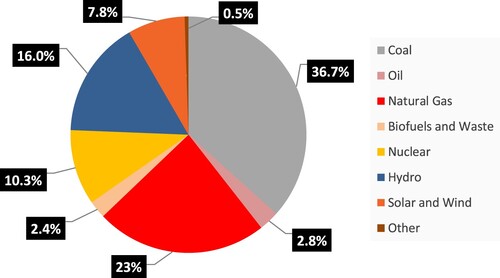
Figure 2. Schematic diagram of the ammonia co-firing system.
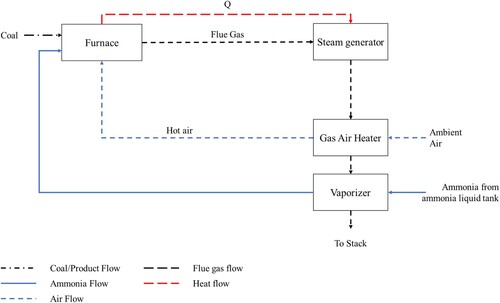
Figure 3. Detailed boiler system of ammonia coal co-firing.
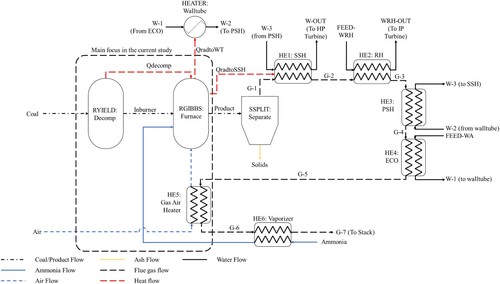
Figure 4. Detailed steam generator system of ammonia coal co-firing.
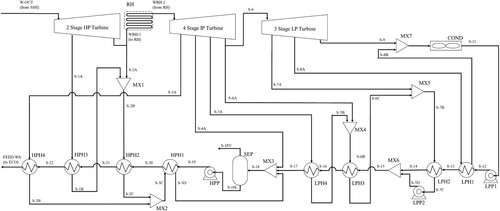
Table 1. The proximate and ultimate analyses of the pulverised coal.
Table 2. The stream data.
Table 3. Simulation results at 100% coal.
Table 4. Comparison of the design specifications and the simulation results.
Table 5. Airflow rate and air to fuel ratio at constant excess oxygen scenario.
Figure 5. Adiabatic and furnace exit gas temperature with different ammonia co-firing rates. (a) Constant Excess Oxygen; (b) Constant Airflow Rate.
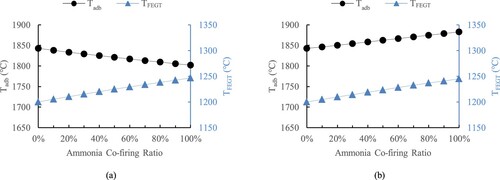
Figure 6. NOx and SOx emission in ppm. (a) Constant Excess Oxygen Scenario; (b) Constant Airflow Rate Scenario.
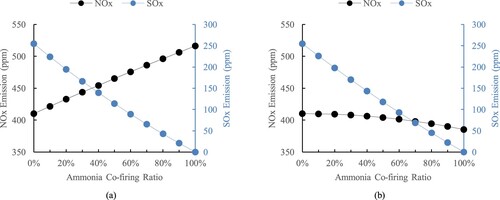
Figure 7. Mole fractions of nitrogen, oxygen, carbon dioxide, and water vapour in the flue gas. (a) Constant Excess Oxygen Scenario; (b) Constant Airflow Rate Scenario.
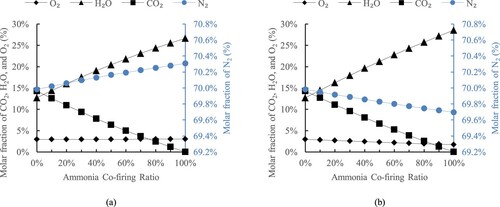
Table 6. The mass flow rate of the entire flue gas and the principal components of the flue gas at the furnace exit under the constant excess oxygen scenario (in tonne/hour).
Table 7. The mass flow rate of the entire flue gas and the principal components of the flue gas at the furnace exit under the constant airflow rate scenario (in tonne/hour).
Figure 8. The temperature of the flue gas stream at different positions in the boiler system. (a) Constant Excess Oxygen Scenario; (b) Constant Airflow Rate Scenario.
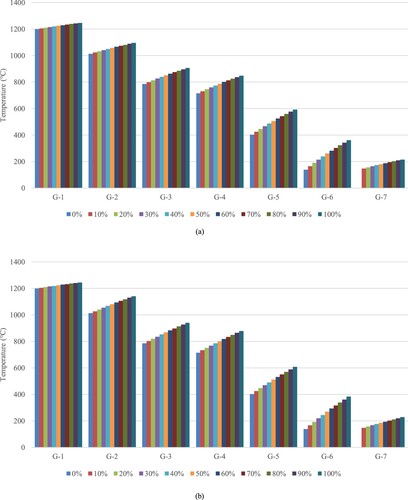
Figure 9. The heat capacity of flue gas stream at different positions in the boiler system. (a) Constant Excess Oxygen Scenario; (b) Constant Airflow Rate Scenario.
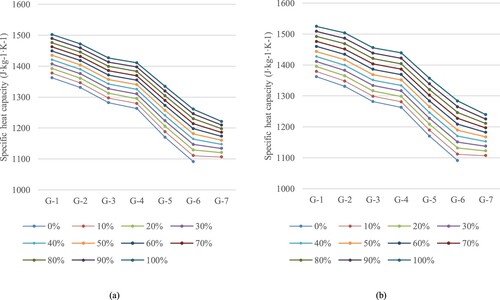
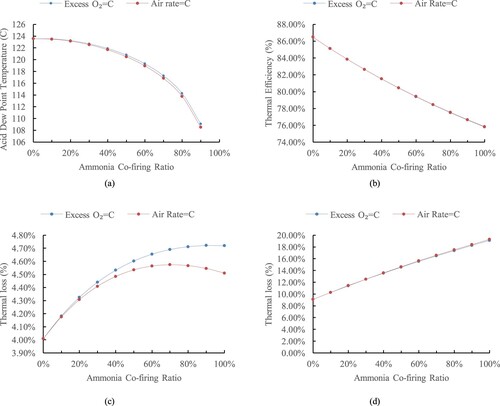
Figure 10. (a) Acid dew point temperature (b) Overall boiler efficiency; (c) Stack losses due to dry flue gas; (d) Stack losses due to water from fuel.