Figures & data
Table 1. Methodology & instrument utilised.
Figure 1. Experimental set-up. (1) Direct Injection CI engine; (2) Electric-dynamometer; (3) Load control; (4) Air box; (5) U-type manometer; (6) Fuel tank; (7) Burette; (8) Gas analyser.
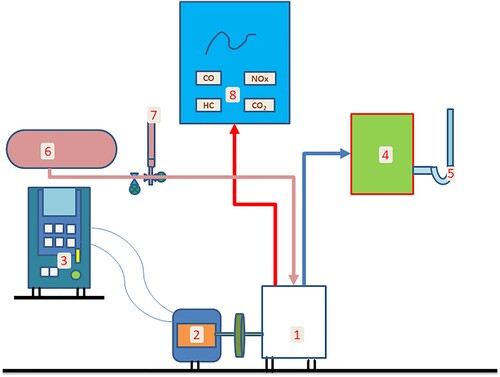
Table 2. Engine and its specifics.
Table 3. Properties of specimens.
Figure 2. D100 – Fourier transform infrared (FTIR) spectroscopy.
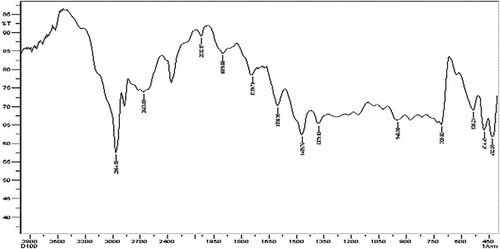
Figure 3. WPF20D80 – Fourier transform infrared (FTIR) spectroscopy.
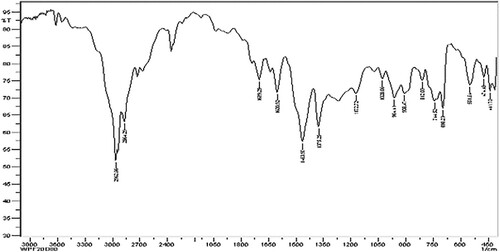
Figure 4. WPF30D70 – Fourier transform infrared (FTIR) spectroscopy.
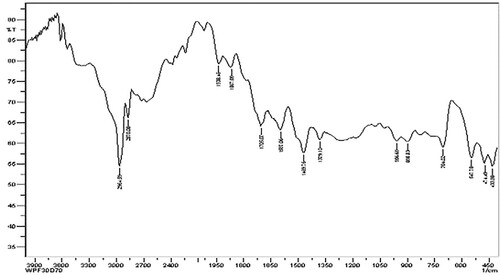
Figure 5. WPF20D70JB10 – Fourier transform infrared (FTIR) spectroscopy.
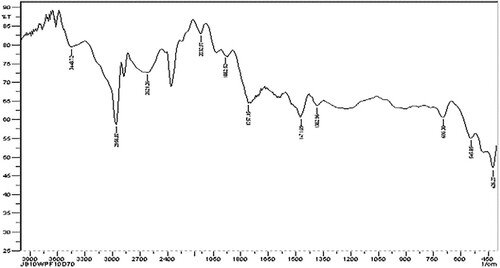
Figure 6. WPF20D60JB20 – Fourier transform infrared (FTIR) spectroscopy.
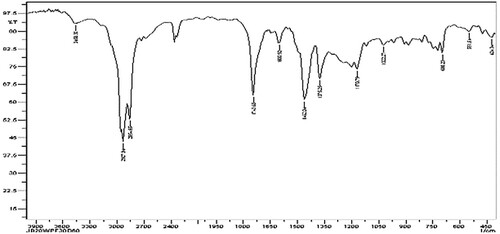
Figure 7. WPF30D40JB30 – Fourier transform infrared (FTIR) spectroscopy.
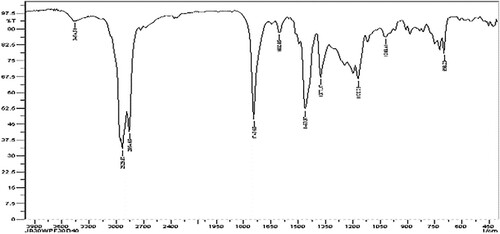
Table 4. Fourier transform infrared spectroscopy of fuel.
Table 5. ‘CHNS’ analysis information for specimens.
Figure 8. GCMS WPF20D80.
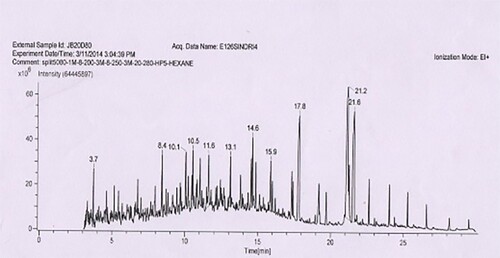
Figure 9. GCMS WPF30D70.
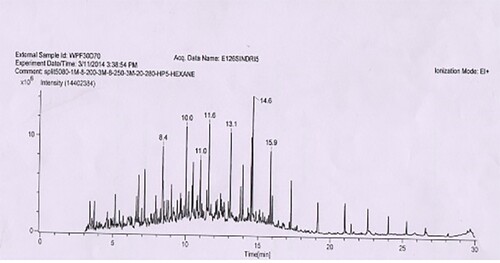
Figure 10. GCMS WPF20D70JB10.
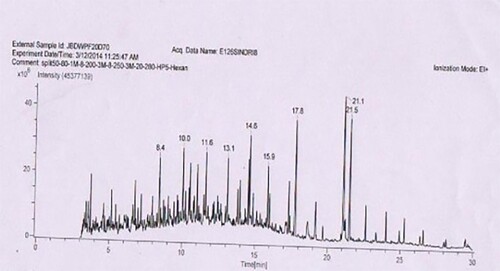
Figure 11. GCMS D100.
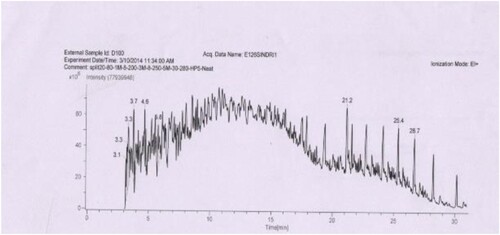
Table 6. ‘GC-MS’ information of WPF20D80.
Table 7. ‘GC-MS’ details of WPF30D70.
Table 8. ‘GC-MS’ information of D100.
Table 9. ‘GC-MS’ information of WPF20D70JB10.
Figure 12. BTE vs. Load.
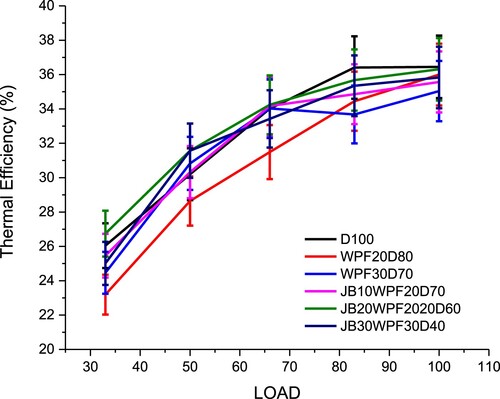
Figure 13. BSFC vs. Load.
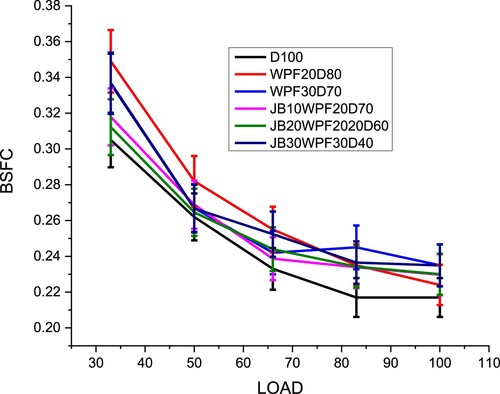
Figure 14. BSEC vs. load.
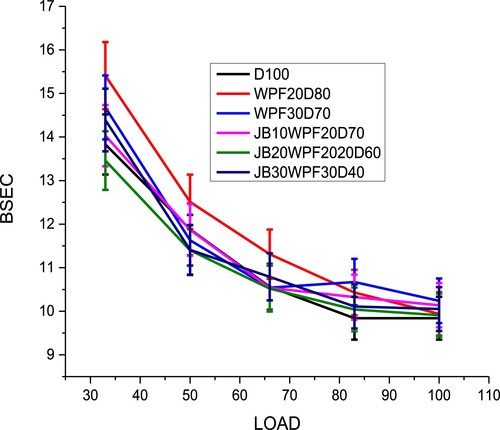
Figure 15. Volumetric eff. Vs. load.
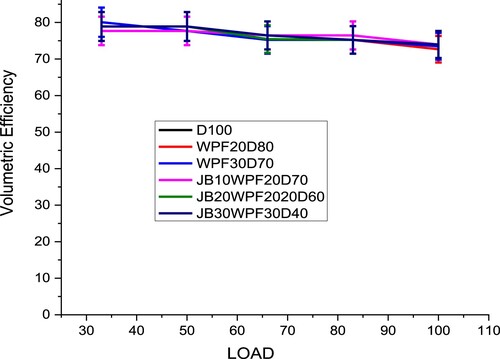
Figure 16. Cumulative Gross HRR vs. load.
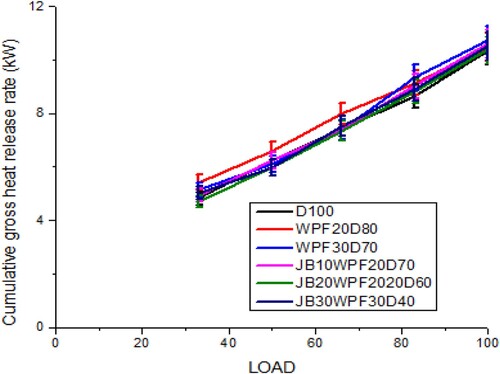
Figure 17. EGT vs. load.
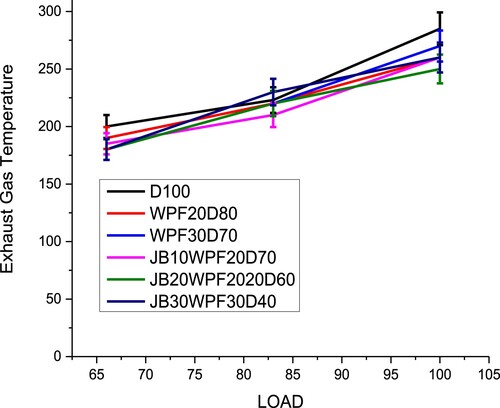
Figure 18. A/F ratio vs. load.
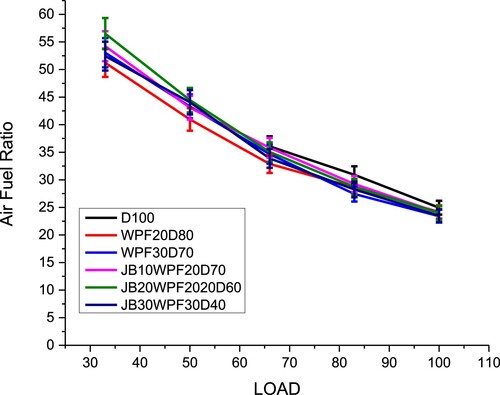
Figure 19. Alterations of HC emission with load.
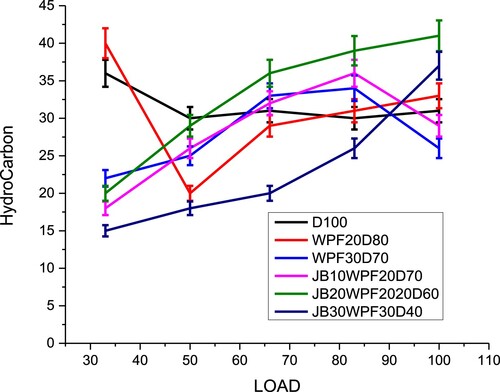
Figure 20. CO emissions vs. load.
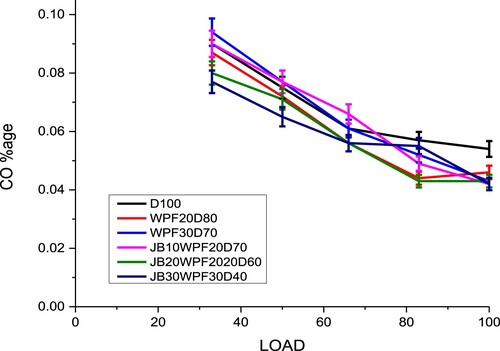
Figure 21. NOx emissions vs. load.
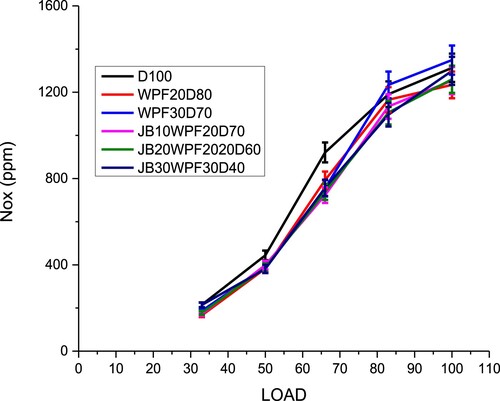
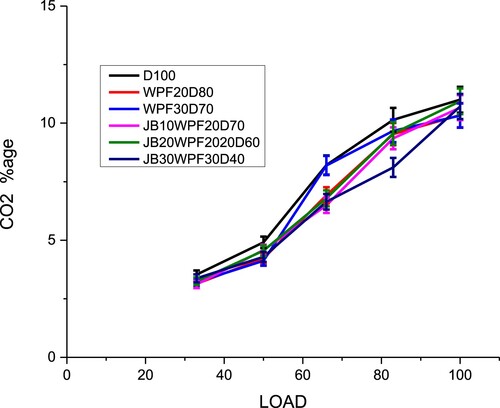
Figure 22. CO2 emissions vs. of load.