
Figures & data
Figure 1. The flow diagram of the study.
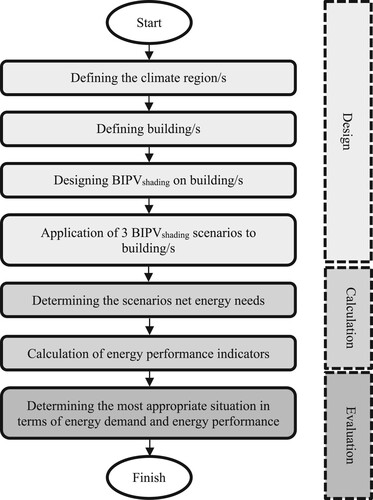
Table 1. The building scenarios.
Table 2. The studies on the accuracy of the PV software used.
Table 3. The city’s global radiation values (KWh/m2-day) by months (Republic of Turkey Ministry of Energy and Natural Resources Citation2023).
Figure 2. Normal floor plans and elevations.
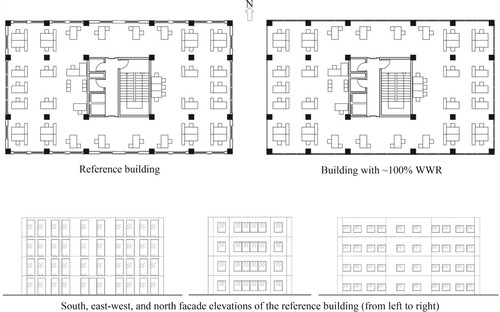
Table 4. The U values of building envelope constructions in İstanbul and Ankara.
Table 5. The Activity and HVAC system variable selections in the building simulation.
Figure 3. The horizontal BIPV system design in the reference building in İstanbul.
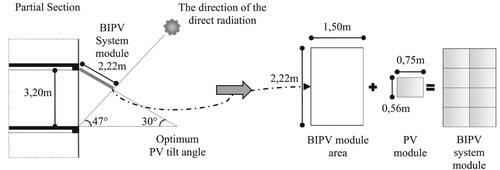
Table 6. The horizontal BIPV system design information designed for building scenarios.
Figure 4. The vertical BIPV system design in the reference building in İstanbul.
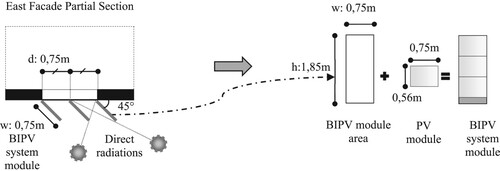
Figure 5. Perspectives of three scenarios from the İstanbul reference building model (neutral position, position with shading device and position with BIPV).
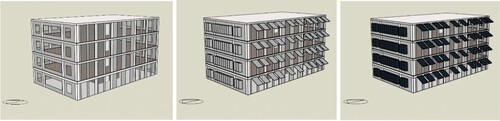
Table 7. The vertical BIPV system design information designed for building scenarios.
Figure 6. PVsyst models of the scenarios with BIPV in Istanbul (the reference building on the left and the building with ∼100% WWR on the right).
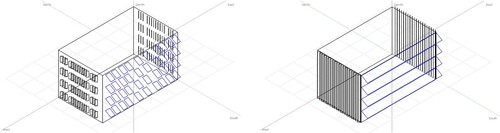
Table 8. PV system specifications and simulation parameters.
Figure 7. The energy analysis results of the building scenarios in İstanbul.
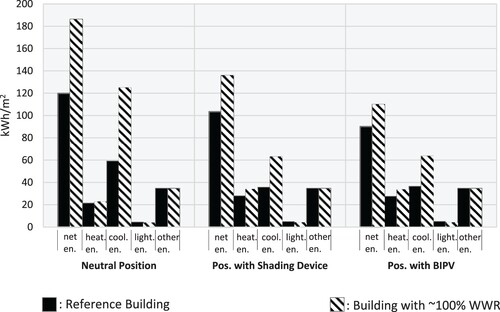
Figure 8. The energy analysis results of the building scenarios in Antalya.
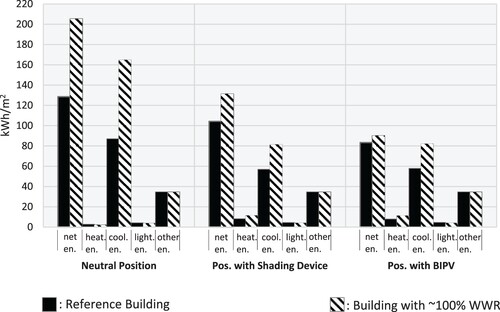
Table 9. The calculation results of the energy indicators and CPV of PV systems.
Table 10. PV energy production and BIPVshading energy gain based on building scenario.