
Figures & data
Figure 1. 2016 load shape with the forecasted 2030 load shape.
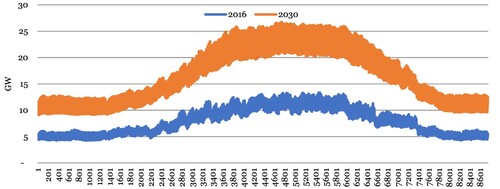
Table 1. Comparison of each of the simulated scenarios.
Figure 2. AES simulated for three winter days where the total electricity demand was fulfilled with 50% PV and 50% wind.
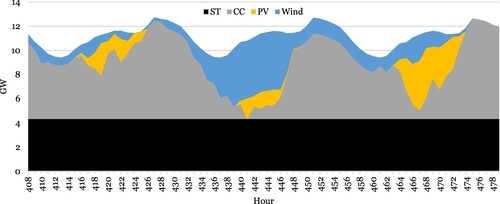
Figure 3. AES simulated for three summer days where the total electricity demand was fulfilled with 50% PV and 50% wind.
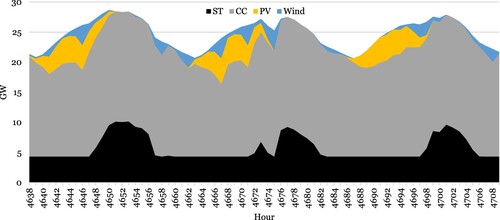
Table 2. Simulation results comparing all three scenarios in terms of expect energy, required capacity, and percent share of total energy.
Figure 4. ICS simulated for three winter days where the RE capacity was fulfilled with 50% PV and 50% wind.
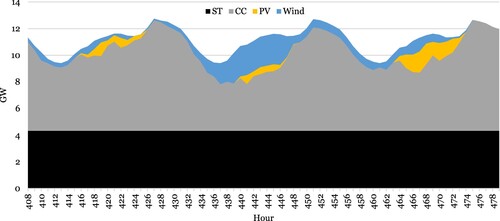
Figure 5. ICS simulated for three summer days where the RE capacity was fulfilled with 50% PV and 50% wind.

Figure 6. PCS simulated for three winter days where the peak capacity was fulfilled with 50% PV and 50% wind.

Figure 7. PCS simulated for three summer days where the peak capacity was fulfilled with 50% PV and 50% wind.
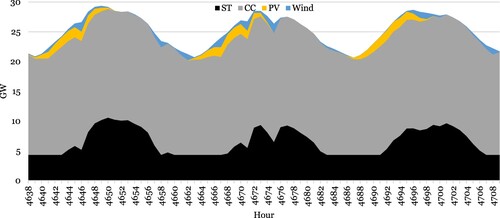
Figure 8. PLS simulated for three winter days where the peak load was fulfilled with 50% PV and 50% wind.
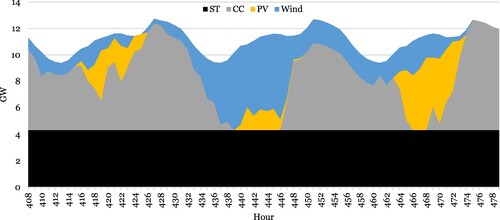
Figure 9. PLS simulated for three summer days where the peak load was fulfilled with 50% PV and 50% wind.
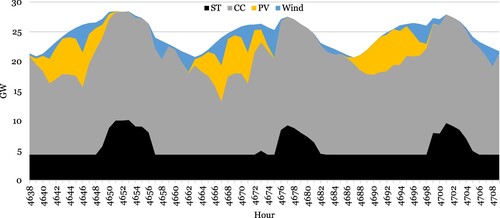
Table 3. Report fuel consumed by MEWRE power stations total (Kuwait National Petroluom Company Citation2019; Ministry of Electricity and Water Citation2022; Wood and Alsayegh Citation2014) as well as average energy content and emission factors used to calculate CO2 emissions (Ministry of Electricity and Water Citation2018; Ministry of Electricity and Water Citation2019; U.S. Environmental Protection Agency Citation2023).
Table 4. Derived emission reductions by scenario.
