Figures & data
Figure 1. Set up of first two replicates of the dilution experiment.
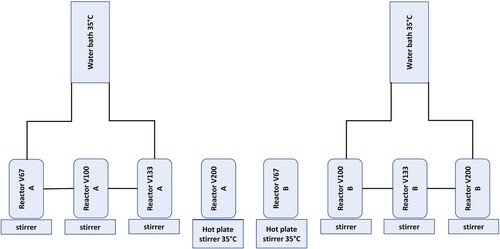
Table 1. Operating conditions for the dilution experiments showing chemical oxygen demand (COD), total solids (TS), volatile solids (VS) and organic loading rate in terms of volatile solids (OLRVS) and chemical oxygen demand (OLRCOD).
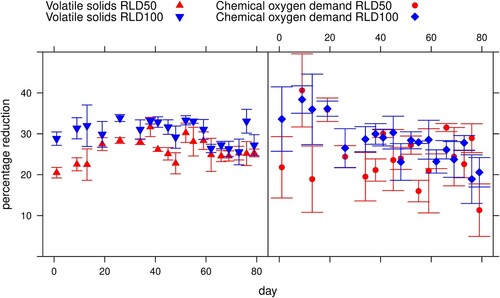
Figure 2. Reduction of chemical oxygen demand and volatile solids
(%) over time. Error bar = standard error.
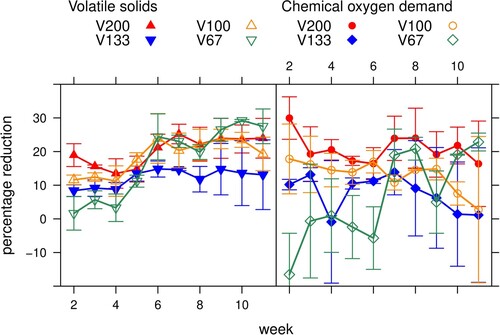
Figure 3. Mean values of pH over running time. Error bar = standard error.
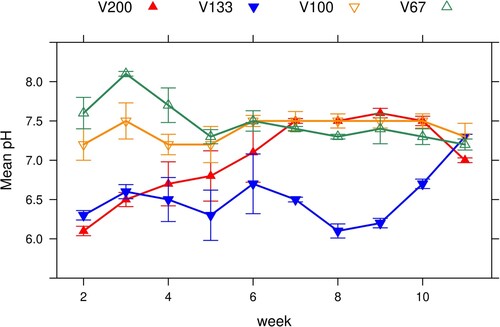
Table 2. Mean and standard error chemical oxygen demand (COD) and volatile solids (VS) reduction in dilution experiment.
Table 3. Properties of the feed used in the recycling experiments Note: Mean of 5–6 samples each (SE given in brackets). Dung: filtrate mixes based on theoretical values. COD = chemical oxygen demand, TS = total solids, VS = volatile solids.
Table 4. Mean volatile solids and chemical oxygen demand reduction
in the 3 recycling phases. Note: Mean values with standard error shown in brackets and significance refers to differences between phases
Figure 5. Mean volatile fatty acid levels (VFA) over running time of reactors.
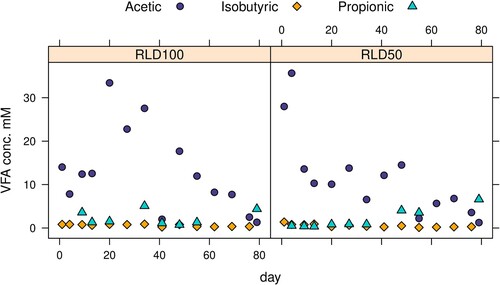
Figure 4. Reduction of chemical oxygen demand and volatile solids
(%) over time with liquid digestate recycling. Error bars = standard error.