Figures & data
Figure 1. Location of candidate sites.
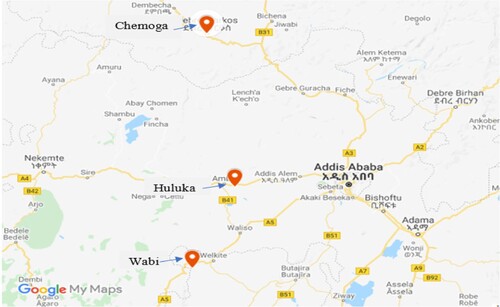
Figure 2. Flow duration curve of the three sites.
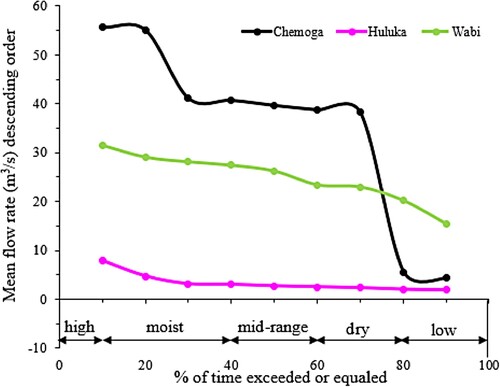
Table 1. Mean annual flow descending order of Chemoga, Huluka, and Wabi Rivers.
Table 2. Calculation of Darcy friction factor (f).
Table 3. Head losses as a function of flow rate.
Figure 3. Performance characteristics of the Piping system.
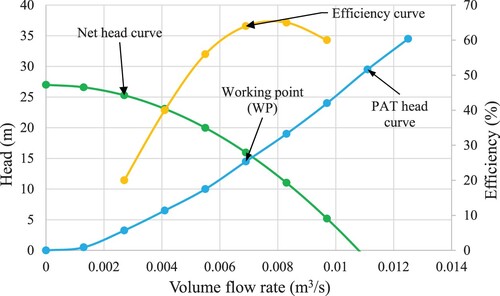
Table 4. Peak load calculation of power demand.
Table 5. Net cash in/out outflow.
Figure 4. Payback period of the project.
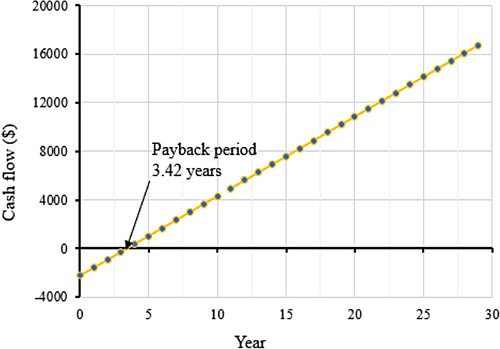
Table 6. Economic feasibility of PAT: Cost and payback analysis.
Table 7. Feed per tooth of cutters.
Table 8. Cutting speed of different materials.
Table 9. Costs and payback period of PAT and cross-flow turbine.
Figure 5. Payback periods for different modification techniques and cross-flow turbine.
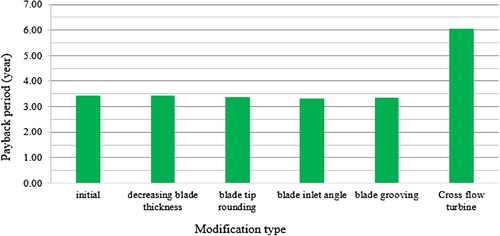
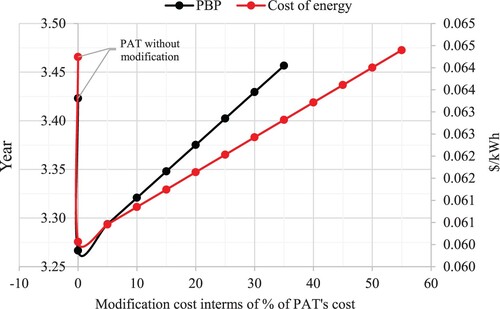
Figure 6. Payback period and cost of energy for impeller modification.