
Figures & data
Table 1. Power consumption of the feeders on annual basis.
Figure 1. Single line diagram of the Motta distribution network.
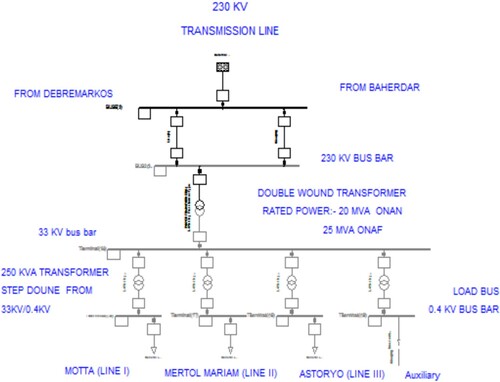
Figure 2. Hourly load of each feeder at Motta substation.
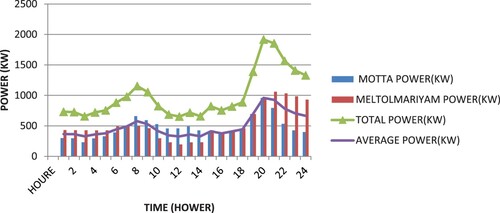
Table 2. Total number of interruptions and duration hours of feeders at the substation.
Figure 3. Reliability analysis procedure using DIgSILENT power factory.
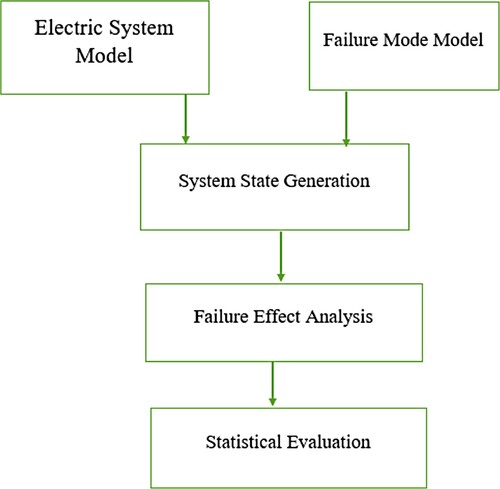
Table 3. Base case system indices.
Table 4. Base case, Monte Carlo, and enumeration of reliability index.
Figure 4. Comparison of bus voltage at Motta distribution feeder.
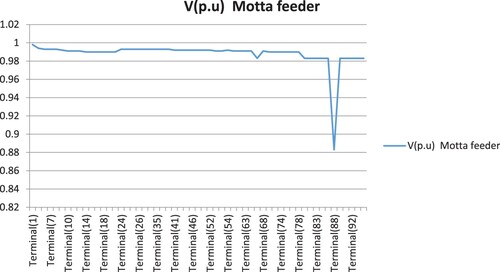
Figure 5. Comparison of bus voltage at Meltolemariyam (M/M) distribution feeder.
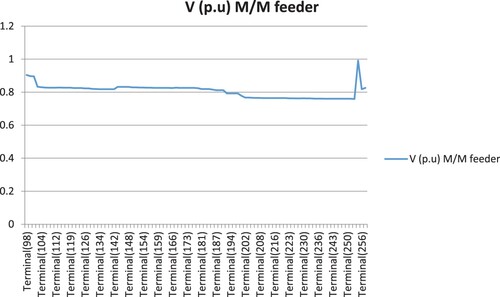
Table 5. Power loss and reliability index variation as DGs increase.
Table 6. Emission levels of different DGs.
Figure 6. Customer-oriented reliability indices with and without DG integration.
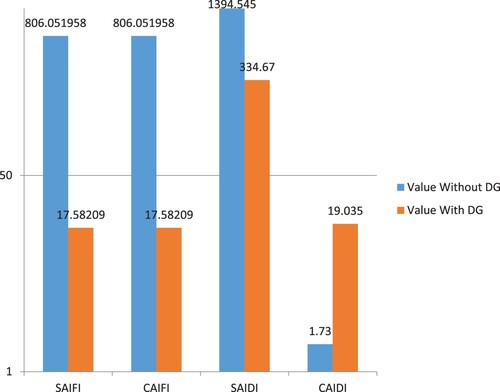
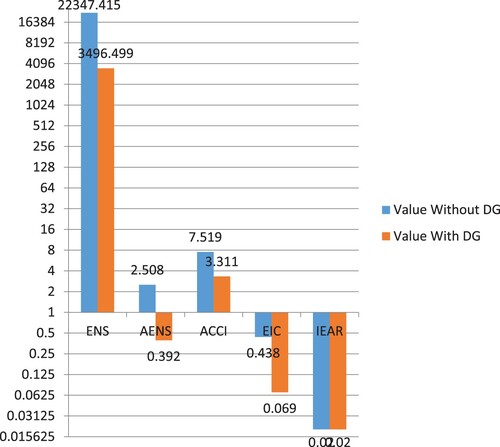
Figure 7. Energy-oriented reliability index with and without DG integration.
Data availability statement
The datasets generated during and/or analysed during the current study are not publicly available but are available from the corresponding author on reasonable request.
