Figures & data
Table 1. Symbols used for the building model identification methodology.
Figure 1. Data slicing for the model relevant identification (MRI) approach using a Kalman Filter (KF) for the generation of the required start values for each data slice
. In order to obtain meaningful start values for the first MRI slice
, a small part at the beginning is required to ensure the filter’s convergence.
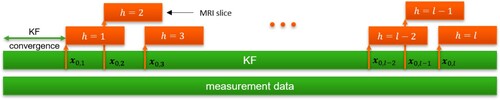
Table 2. Symbols used for the distributed optimisation methodology.
Table 3. Overview of the basic data and use of the buildings of quarter Q1 of Reininghausgründe in Graz, Austria.
Figure 2. Exemplary result of the identification of the linearised zone model for one of the simulated zones.
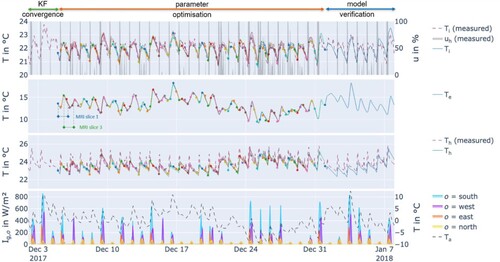
Figure 3. Evaluation of the mean absolute error (MAE) over the look ahead time for each zone (blue). The mean over all zones is indicated in orange.
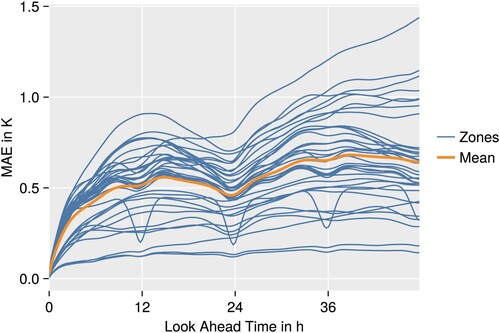
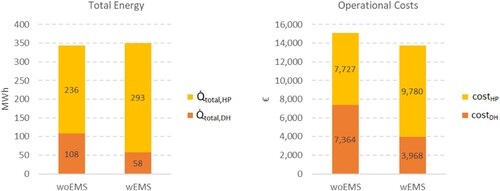
Figure 4. Comparison of the duration lines of the total thermal load of the apartment and commercial zones without EMS (woEMS) and with EMS (wEMS).
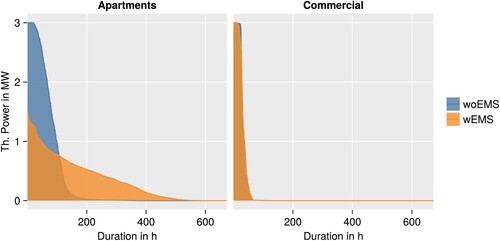
Figure 5. Co-simulation results without EMS (woEMS) and with EMS (wEMS). The upper plot shows the total heat flow from the energy hub. The lower plot shows the mean zone temperature of the apartment zones, weighted by the respective floor area, and the chosen comfort band of 22 1 °C.
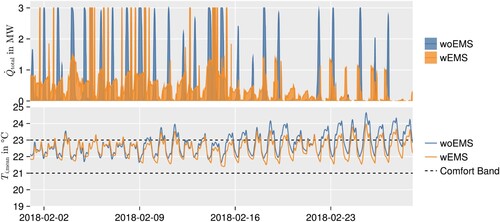
Figure 6. Results of the economic evaluation. The overall costs are about 9% lower when using the distributed EMS.