Figures & data
Figure 1. InnoSolPower system concept.
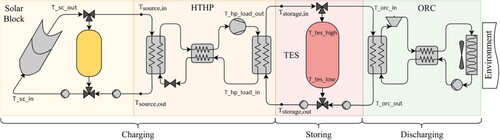
Table 1. Main operation parameters.
Table 2. Comparison matrix A of criteria.
Table 3. Weight of criteria.
Table 4. Final ranking of the candidate PCMs.
Table 5. Thermodynamic properties of magnesium chloride hexahydrate MCH.
Table 6. Dimensions of cylinders and tank.
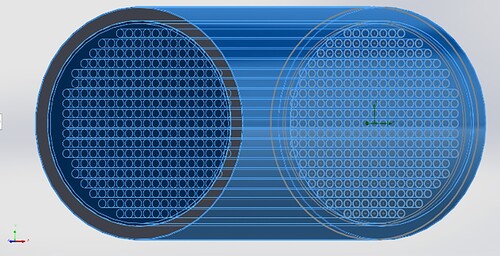
Figure 2. Left: Side view of the tank consisting of 1 pack of cylinders. Right: Cross section and dimensions (cm) of the TES tank with 293 tubes inside.
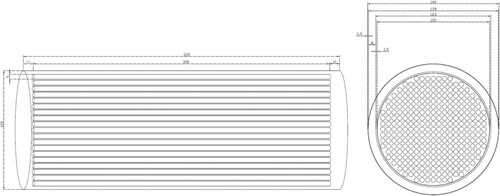
Figure 3. Application of constant wall temperature of cylinders at 117°C.
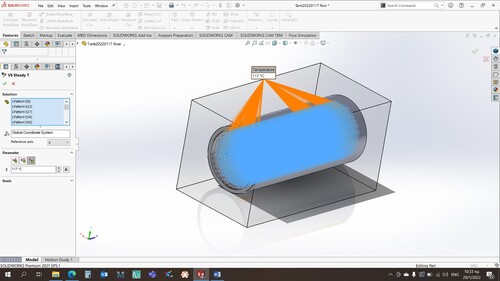
Table 7. CFD simulation results of TES charging process.
Figure 4. Temperature surface plots for the tank envelope and the cylinders at steady-state for the charging process. The fluid flow inlet is at the centre of the axes.
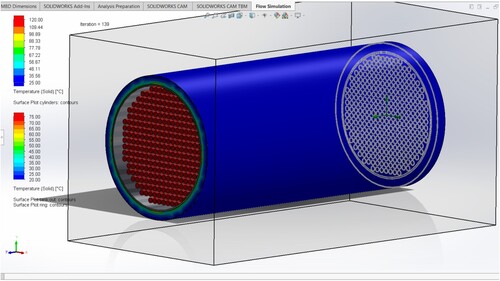
Figure 5. Temperature cut contours in the longitudinal section for the whole tank at steady-state for the charging process. The fluid flow is from left (axis centre) to right.
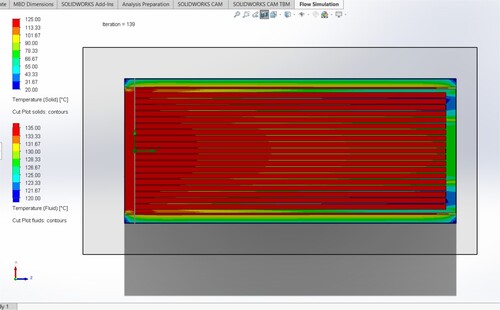
Figure 6. Temperature cut plots in the transverse section, near the exit of the tank, at steady-state for the charging process.
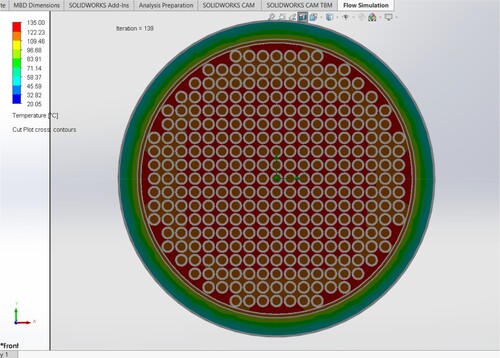
Figure 7. Temperature surface plots for the tank envelope and the cylinders at steady-state for the discharging process. The fluid flow inlet is at the centre of the axes.
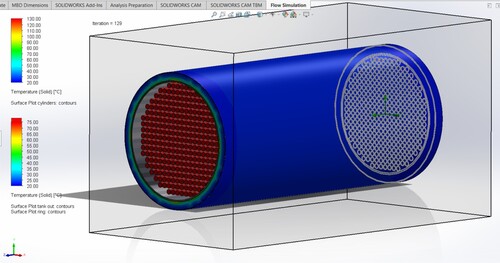
Table 8. CFD simulation results of TES discharging process.
Figure 8. Temperature cut plots in the longitudinal section for the whole tank at steady-state for the discharging process.
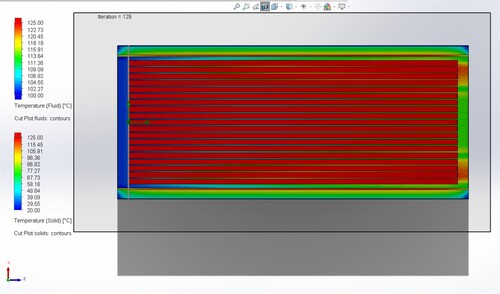
Figure 9. Temperature cut plots in the transverse section, near the exit of the tank, at steady-state for the discharging process.
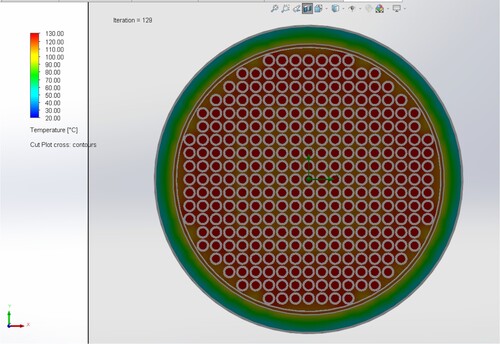
Figure 10. Extruded Boss/Base and creation of solid regions, in the SOLIDWORKS Feature add-in.
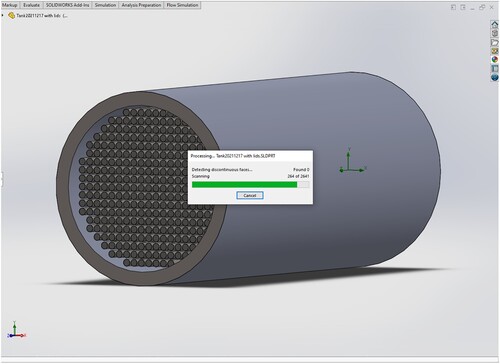
Figure 11. Adding the new heat transfer fluid, Therminol SP (Eastman Chemical Company Citation2023).
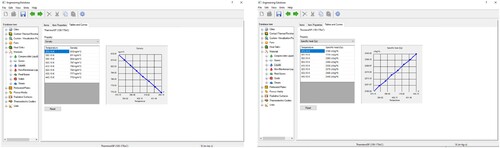
Figure 12. Selection of appropriate computational domain for the 3-D simulation
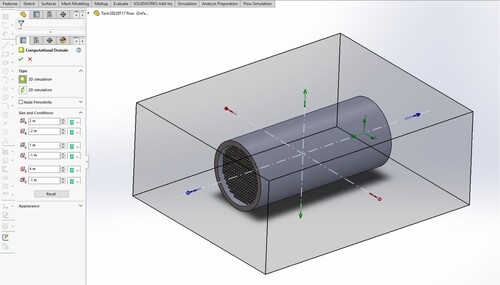
Figure 13. Stainless steel material applied in the tank envelope and the cylinders.