
Figures & data
Figure 1. a) presents the map and coordinates of Afghanistan, and b) indicates the research area.
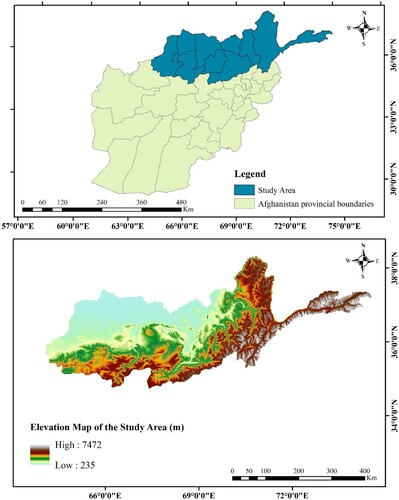
Table 1. Presents a concise overview of the source datasets utilized in this research.
Table 2. Population of study area separated by provinces.
Figure 2. Map of criteria used in this research; a) solar radiation, b) LST, c) slope, d) elevation, e) aspect, f) distance to grid network, g) distance to road, h) distance to rivers, i) distance to the residential area, j) land use/cover, k) air temperature.
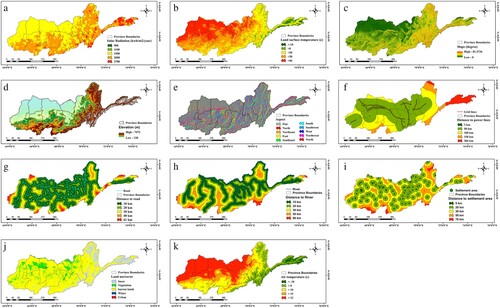
Table 3. Statistical information of the criteria used in this research.
Figure 3. Workflow of the methodology.
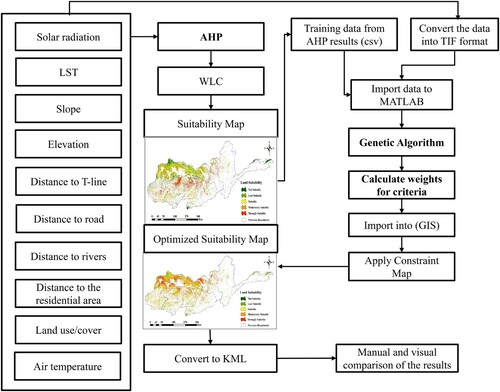
Table 4. Dictates the scale of the importance.
Table 5. Shows the compression of the criteria.
Table 6. Presents the Random index values.
Table 7. Per-wised compression matrix for solar power site selection.
Figure 4. Presents the AHP structure.
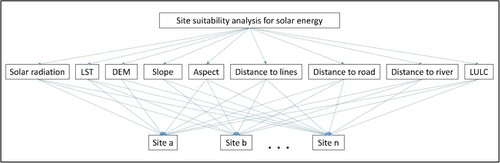
Figure 5. The workflow of the methodology, based on the AHP method.
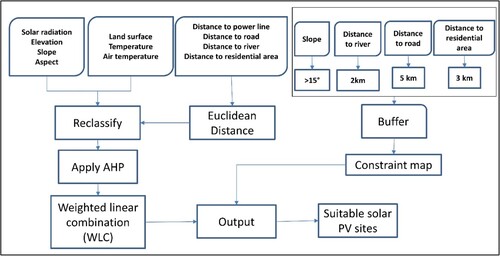
Table 8. Obtained weights for the criteria for the solar PV.
Figure 6. Indicates conducted workflow used in GA optimization.
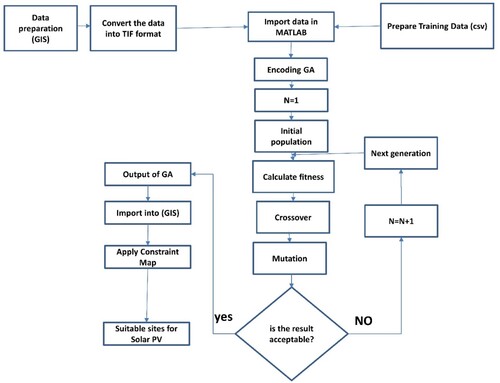
Figure 7. Indicates available lands of potential, based on classes of potentiality and provinces
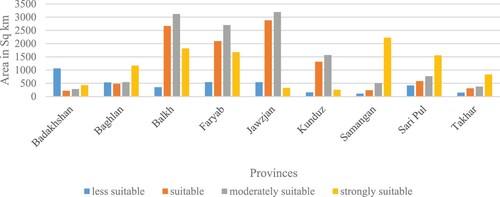
Table 9. Presents the weights of layers calculated by GA.
Figure 8. Potential map of the Solar energy obtained by the AHP method.
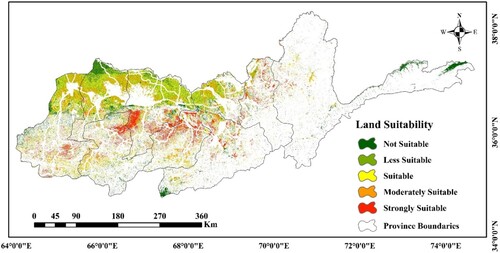
Figure 9. Indicates potential solar PV lands based on the class of potentiality and provinces.
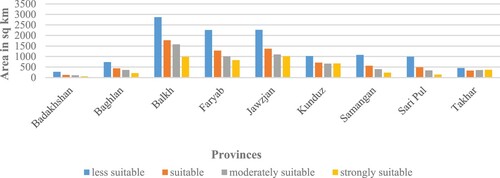
Figure 10. Potential map of the Solar energy obtained by the genetic optimization algorithm.
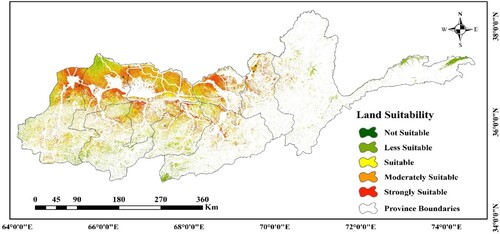
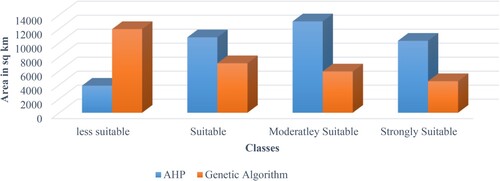
Figure 11. Indicates a comparative presentation of the available area for each suitability class according to the outputs of GA and AHP.
Data availability
Data will be available upon request.
