
Figures & data
Figure 1. Process of analysis used for the study. Source: Author’s compilation.
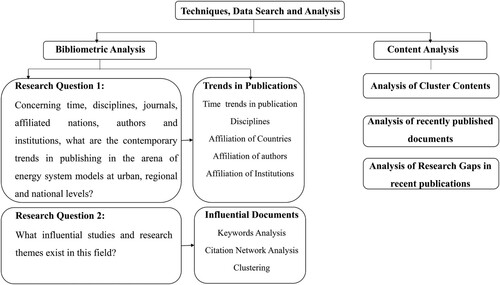
Table 1. Subject areas chosen for the document search.
Table 2. Number of articles found as a result of search queries in the Scopus literature database.
Table 3. Publication of documents by type.
Figure 2. Publication of documents by year. Source: Author’s compilation from the Scopus analysis built in tool.
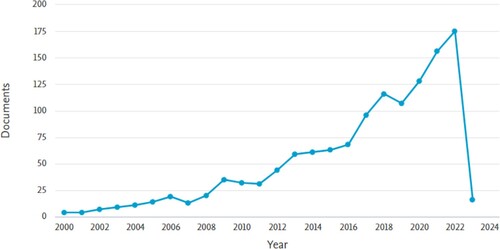
Figure 3. (a) Network Visualisation of Keywords. (b) Overlay Visualisation of Keywords. Source: Authors’ contribution using VOSviewer.
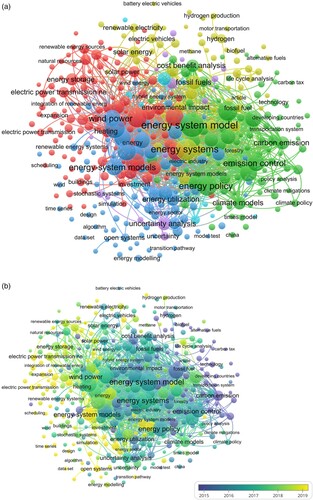
Table 4. Analysis of the number of documents by source, affiliation, country and author.
Table 5. Topmost keywords of energy systems modelling built on the occurrences and link strength.
Figure 4. Overlay Visualisation of Citations based on score of cited articles per year and total link strength.
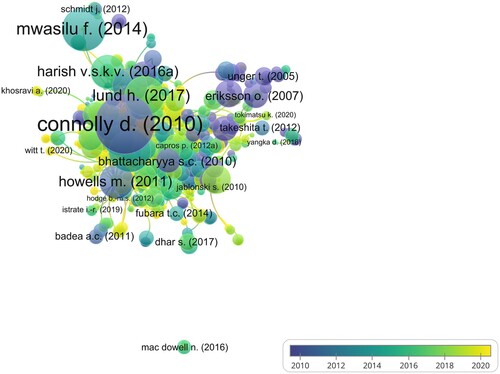
Table 6. Most often cited articles among the scientific publications on Energy System Models retrieved from VOS viewer.
Table 7. Top 20 sources authors, organisations and countries on the basis of total link strength and citations.
Figure 5. Overlay Visualisation of Citations by Sources based on total link strength and citation scores. Source: Compiled by the authors using VOSviewer.
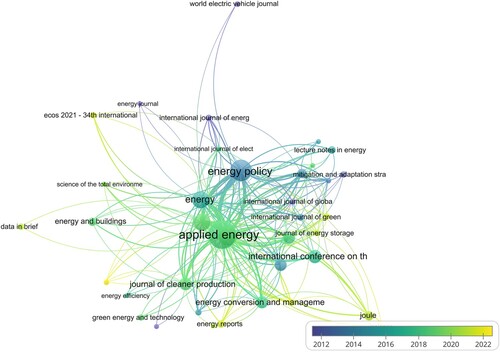
Figure 6. Overlay Visualisation of Citations of Authors based on citation scores and total link strength. Source: Compiled by the authors using VOSviewer.
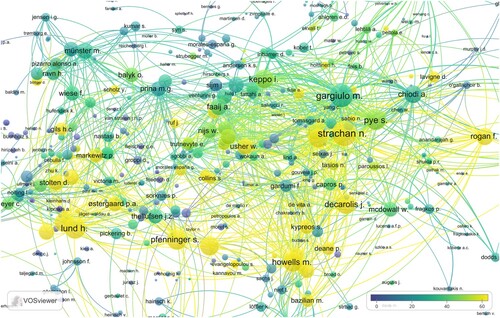
Figure 7. Overlay Visualisation of Citations Score of Organisations based on total link strength and citation scores. Source: Authors’ contribution using VOSviewer.
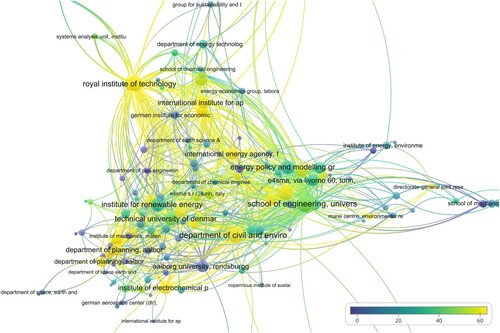
Figure 8. Overlay Visualisation of Citations Score of Documents by Countries based on total link strength and citation scores. Source: Compiled by the authors using VOSviewer.
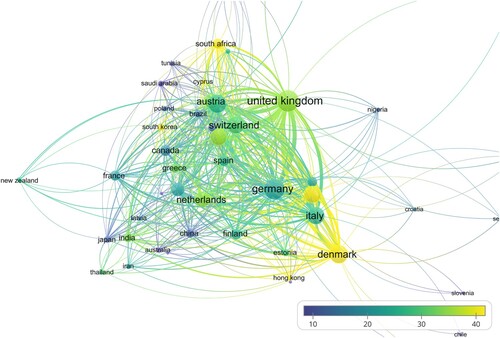
Figure 9. Conceptual diagram of bibliographic coupling. Source: Adapted from Garfield (Citation1988).
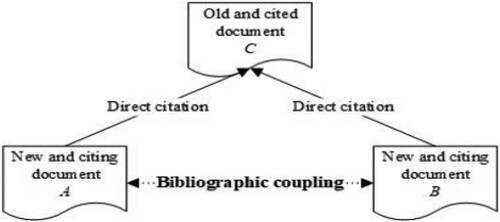
Figure 10. (a) Bibliographic coupling of Documents based on total link strength and citation scores. (b) Scaled up figure showing Bibliographic coupling of Documents based on total link strength and citation scores. Source: Compiled by the authors using VOSviewer.
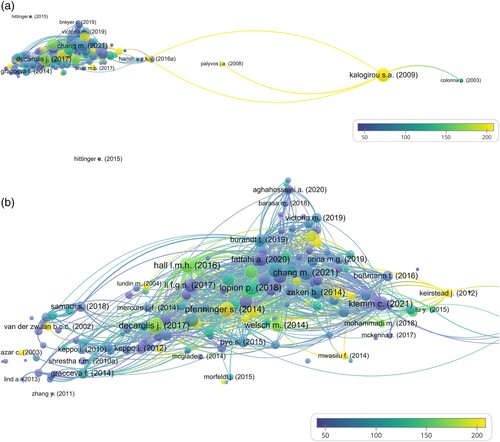
Figure 11. Bibliographic coupling of Sources based on total link strength and citation scores. Source: Compiled by the authors using VOSviewer.
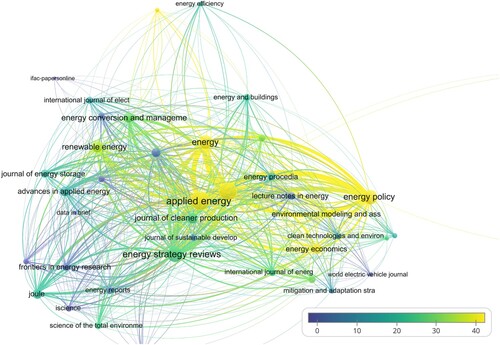
Figure 12. Bibliographic coupling of Authors based on total link strength. Source: Compiled by the authors using VOSviewer.
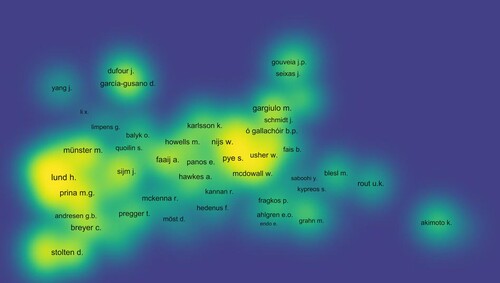
Figure 13. Bibliographic coupling of Organisations based on total link strength and citation scores. Source: Compiled by the authors using VOSviewer.
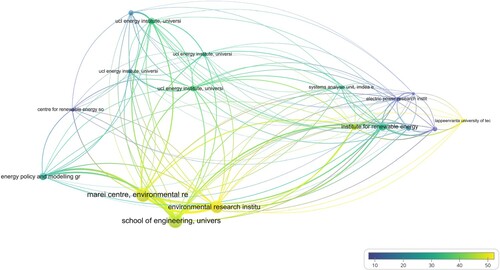
Figure 14. Bibliographic coupling of Countries based on total link strength and citation scores. Source: Compiled by the authors using VOSviewer.
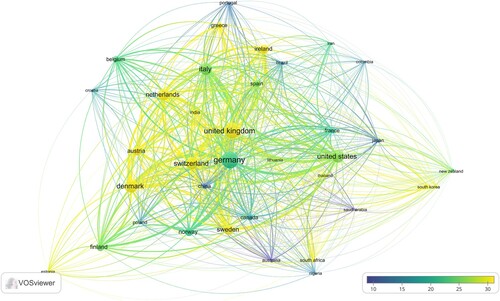
Figure 15. Co-citation analysis for cited sources based on citation scores. Source: Compiled by the authors using VOSviewer.
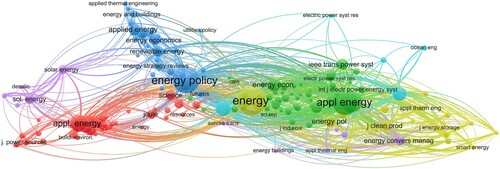
Figure 16. Co-citation analysis for cited authors based on citation scores. Source: Authors’ Contribution using VOSviewer.
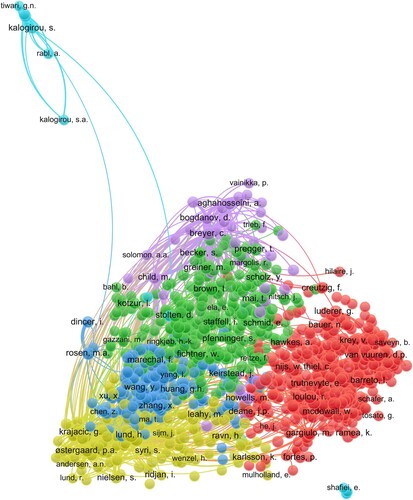
Table 8. Co-Citation analysis for top 10 cited authors, cited sources and cited references , cited sources and cited authors.
Table 9. Clustering of Keywords(K) and representing top 10 keywords from each cluster on the basis of Total Link Strength (TLS) and Occurrences (O).
Table 10. Clustering of Articles, their year of publication and their presentation based on total link strength and co-citation of cited references.
Table 11. Cluster themes and major topics explored in each cluster.
