Figures & data
Figure 1. Overview pipeline SHP2SIM.
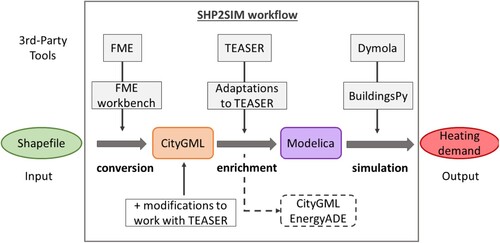
Figure 2. FME workbench.
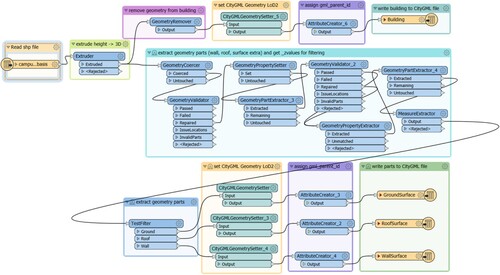
Figure 3. Case study area Campus Inffeldgasse.
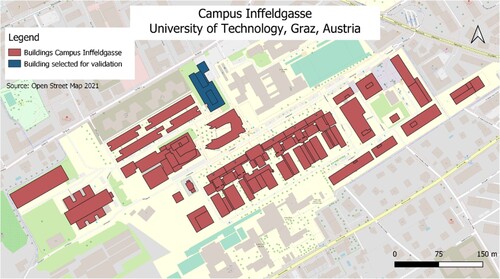
Figure 4. Graphical representation of 3D CityGML model.
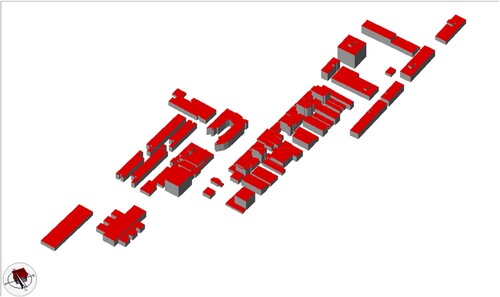
Figure 5. Yearly heat load for all simulated buildings in the use case area.
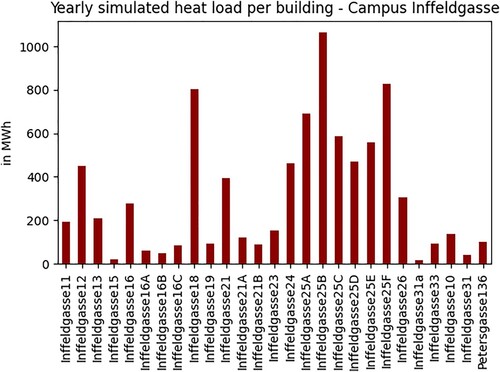
Table 1. Share of zones in the case study building.
Table 2. Building parameters for Inffeldgasse 12.
Table 3. Simulated and measured heat load of the case study building for one year.
Figure 6. Daily simulated and measured heat load for Inffeldgasse 12.
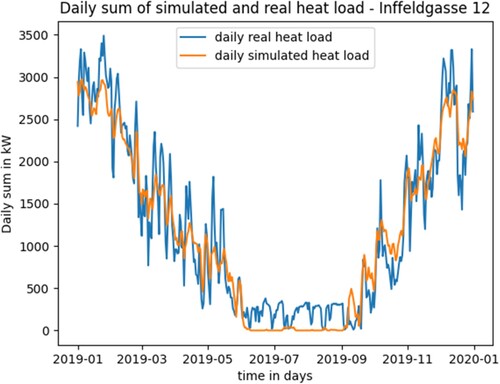
Figure 7. Simulated and measured heat load for Inffeldgasse 12 during day and night.
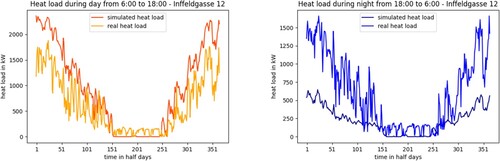
Figure 8. Indoor air temperature, set point for heater and heat load for Inffeldgasse 12 (building part 1 and zone 1 (office)) for first 10 days of simulation.
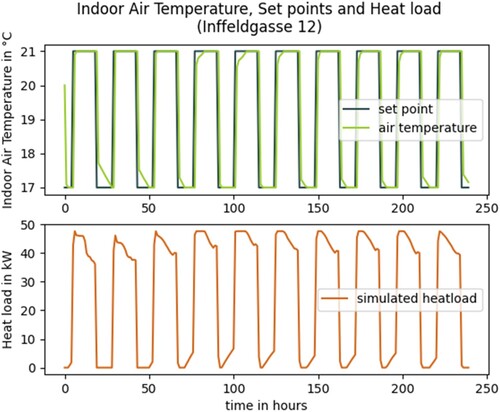
Table 4. Performance evaluation.
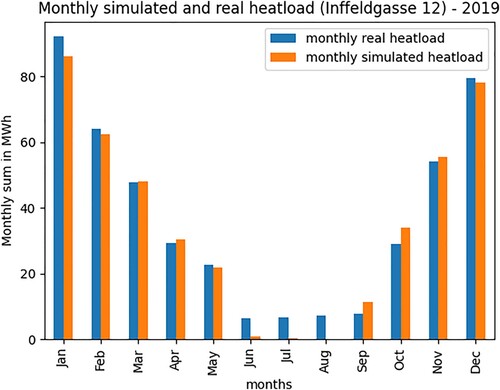
Figure 9. Monthly simulated and measured heat load for Inffeldgasse 12.