
Figures & data
Table 1. Boundary conditions that are considered for the numerical simulation.
Table 2. Numerical Simulation model characteristics.
Figure 1. Water Consumption [L/h] Versus Time [h].
![Figure 1. Water Consumption [L/h] Versus Time [h].](/cms/asset/267c063f-2971-4790-84c9-e89944b4edb2/gsol_a_2250868_f0001_oc.jpg)
Table 3. Boundary Conditions.
Table 4. Investigated Configurations – Domains.
Table 5. Investigated Configurations – Domains (cont’d).
Figure 2. Building-integrated Solar Collector Structure.
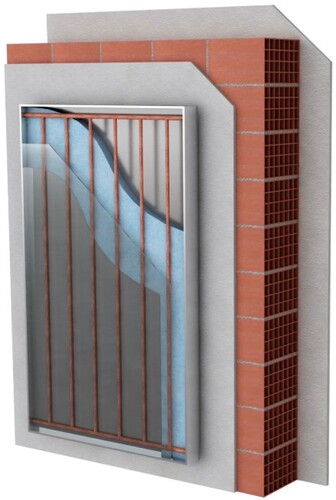
Figure 3. Riser Fluid Velocity – Uniform Riser.
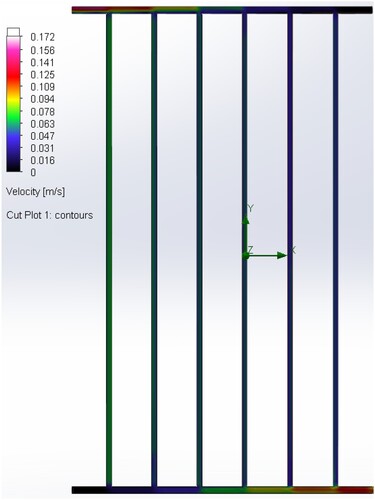
Figure 4. Riser Fluid Velocity – Multiple Riser Configuration One.
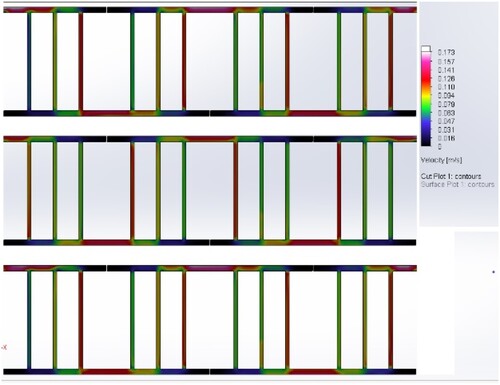
Figure 5. Riser Fluid Velocity – Multiple Riser Configuration Two.
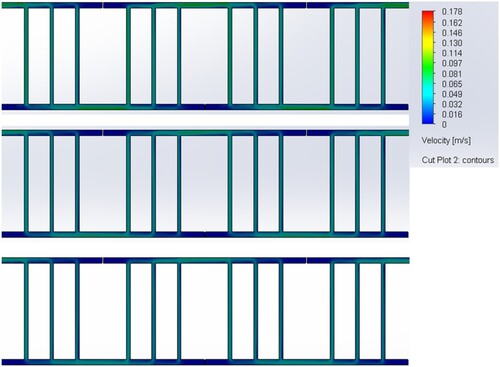
Table 6. Building-Integrated Solar Collector Materials.
Table 7. Minimum, average and maximum – System fluid temperatures [°C] at Slope 0°.
Table 8. Minimum, average and maximum – System fluid temperatures [°C] at Slope 45°.
Table 9. Minimum, average and maximum – System fluid temperatures [°C] at Slope 90°.
Figure 6. Experimental Vs Numerical – Riser Outlet – Fluid Temperature.
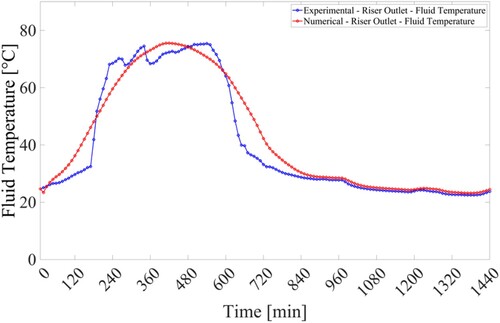
Figure 7. System Average Fluid Temperature – Multiple Riser Configuration One – Water Consumption Comparison – August – South – Slope 90° – Last 24 h.
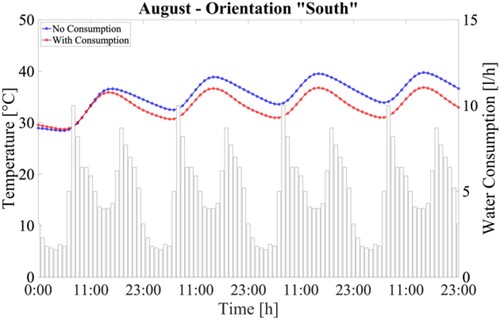
Figure 8. System Average Fluid Temperature – Multiple Riser Configuration One – Water Consumption Comparison – November – South – Slope 90° – Last 24 h.
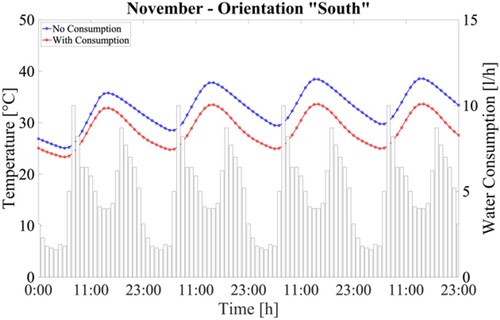
Figure 9. Average System Temperature [°C] – All Months, Slope 0°,45° and 90°.
![Figure 9. Average System Temperature [°C] – All Months, Slope 0°,45° and 90°.](/cms/asset/bfc526bd-3c61-44f0-a742-cbeaa394474a/gsol_a_2250868_f0009_oc.jpg)
Figure 10. Average System Temperature [°C] Vs Orientation – All Months, Slope 45°.
![Figure 10. Average System Temperature [°C] Vs Orientation – All Months, Slope 45°.](/cms/asset/95dc8f03-ea20-449c-8247-1e79b719a36c/gsol_a_2250868_f0010_oc.jpg)
Figure 11. Average System Temperature [°C] Vs Orientation – All Months, Slope 90°.
![Figure 11. Average System Temperature [°C] Vs Orientation – All Months, Slope 90°.](/cms/asset/4bc04d33-50ed-4f0e-8ba9-d792c94a26f9/gsol_a_2250868_f0011_oc.jpg)
Figure 12. Total daily Heat flux [W/m2] Inwards and Outwards of the building wall – Building Integrated Solar Collector Vs No Solar Collector.
![Figure 12. Total daily Heat flux [W/m2] Inwards and Outwards of the building wall – Building Integrated Solar Collector Vs No Solar Collector.](/cms/asset/c9d8d51d-f138-4e75-a102-27c5b444ca8c/gsol_a_2250868_f0012_oc.jpg)
Figure 13. Temperature distribution [K] Outer surface of the collector end in the area in contact with the building envelope – System 2A – August – South Orientation.
![Figure 13. Temperature distribution [K] Outer surface of the collector end in the area in contact with the building envelope – System 2A – August – South Orientation.](/cms/asset/81be27af-ab5b-4c80-ad41-32254441b422/gsol_a_2250868_f0013_oc.jpg)
Figure 14. Temperature distribution [K] Outer surface of the collector end in the area in contact with the building envelope – System 2A – March – South Orientation.
![Figure 14. Temperature distribution [K] Outer surface of the collector end in the area in contact with the building envelope – System 2A – March – South Orientation.](/cms/asset/4ea6eedb-f66d-41f9-a808-d4846929f4d7/gsol_a_2250868_f0014_oc.jpg)
Figure 15. Temperature distribution [K] Outer surface of the collector end in the area in contact with the building envelope – System 2A – November – South Orientation.
![Figure 15. Temperature distribution [K] Outer surface of the collector end in the area in contact with the building envelope – System 2A – November – South Orientation.](/cms/asset/0e2a1f11-ee1f-47bb-81b5-fd2cf94bfa3c/gsol_a_2250868_f0015_oc.jpg)
Figure 16. Temperature distribution [K] Outer surface of the collector end in the area in contact with the building envelope – System 2A – January – South Orientation.
![Figure 16. Temperature distribution [K] Outer surface of the collector end in the area in contact with the building envelope – System 2A – January – South Orientation.](/cms/asset/06759b5c-8c09-430a-8cfe-bf7043607472/gsol_a_2250868_f0016_oc.jpg)
Data availability statement
The data that support the findings of this study are openly available in Mendeley Data and Zenodo at http://doi.org/10.17632/xcpyjj2gv7.2 and http://doi.org/10.5281/zenodo.5284639 respectively.