Figures & data
Figure 1. Pulp mill into a biorefinery conversion (reproduced diagram by Arkola H. (Elomatic OY)).
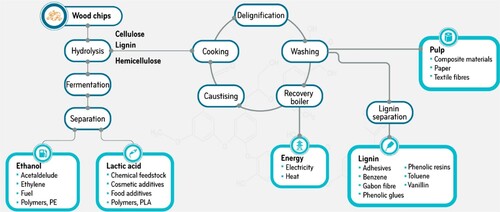
Figure 2. Lignin production and potential lignin-derived product market and value (reproduced diagram by (Gosselink Citation2011)).
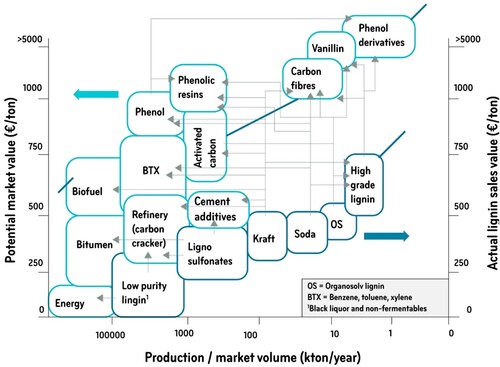
Figure 3. Lignin valorisation into different high-value products for diverse applications (reproduced diagram by (Bilal et al. Citation2022)).
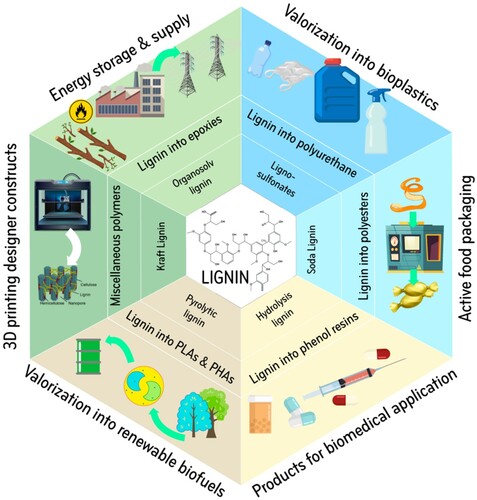
Table 1. Environmental burdens from cradle-to-gate for Borregaard’s products (values obtained from Modahl and Vold (Citation2011)).
Figure 4. Circular Bioeconomy (reproduced diagram by (Newton et al. Citation2017)).
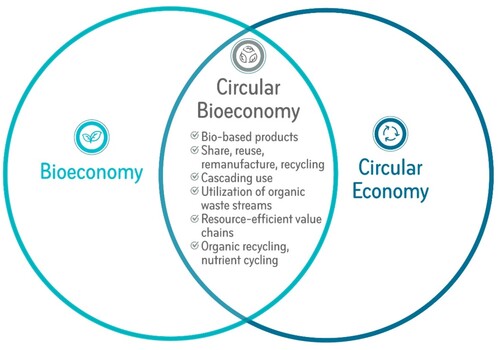
Figure 5. Material use of wood creates the highest value (reproduced diagram by Metsä Group’s material).
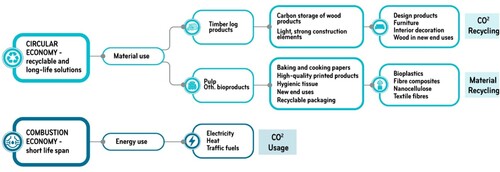
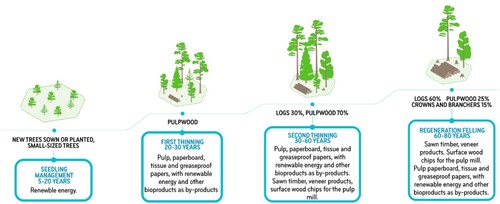
Figure 6. Forest life cycle (reproduced diagram by (Metsä Group Citation2019)).