Figures & data
Figure 1. Methodology flowchart.
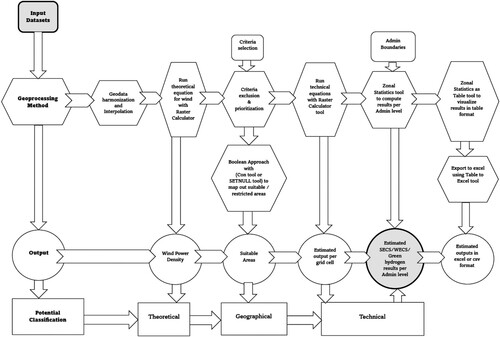
Figure 2. Spatial representation of case study country, (a) Map of Ghana with regional boundaries, (b) Geographical location of Ghana.
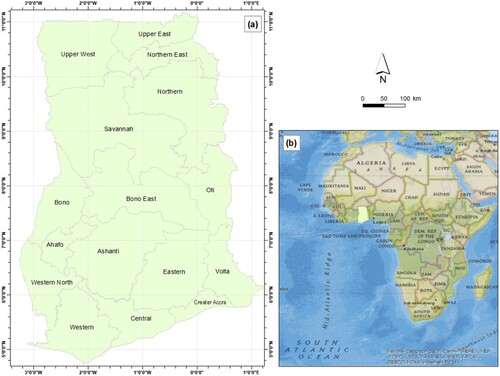
Figure 3. Geospatial data inputs for the land suitability analysis: a. Elevation map; b. Population density map; c. restricted areas; d 20 km buffer distance around grid network.
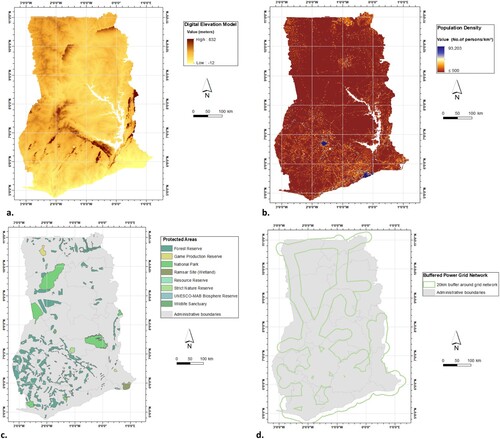
Table 1. Technical specifications for the green hydrogen modelling.
Table 2. Summary statistics for the solar-based green hydrogen analysis.
Table 3. Summary statistics for the wind-based green hydrogen analysis.
Figure 4. Visualisation of the solar irradiance and wind speed distribution.
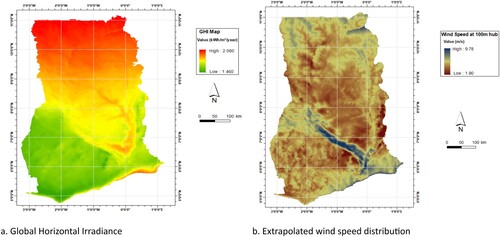
Figure 5. Solar energy potential from the SECS with corresponding green hydrogen production using solar with no spacing factor.
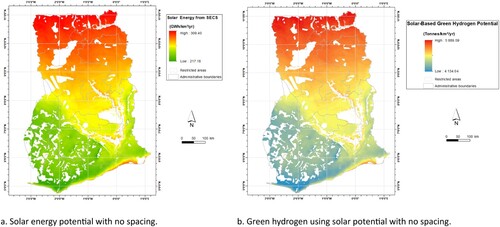
Figure 6. Solar-based green hydrogen technical potential model.
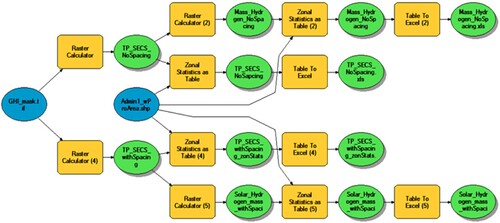
Figure 7. Wind energy potential from the WECS with corresponding hydrogen production with no spacing factor.
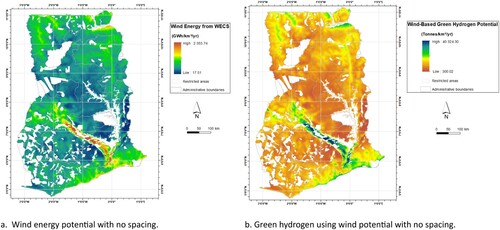
Figure 8. The wind turbine capacity factor with corresponding wind energy generated per region.
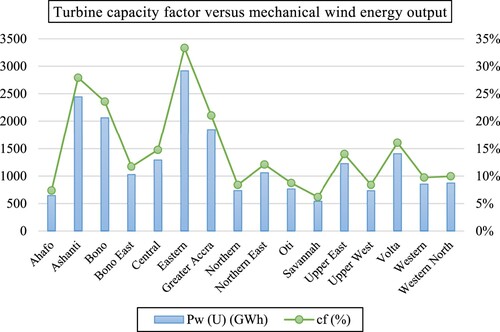
Figure 9. Wind-based green hydrogen technical potential model.
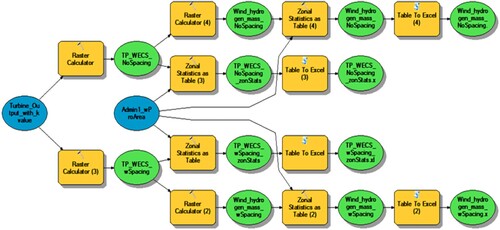
Figure 10. Potential for utility-scale solar-based green hydrogen.
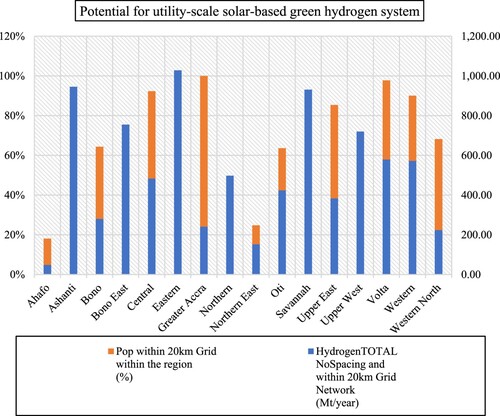
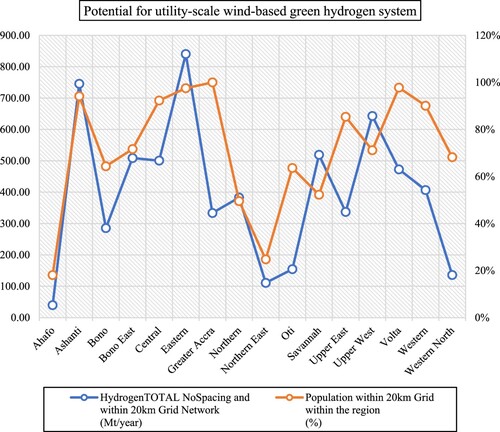
Figure 11. Potential for utility-scale wind-based green hydrogen.