Figures & data
Figure 1. The Levelised cost of energy for various reactors designs built in various countries for different cost parameters. Source: (Rothwell Citation2016).
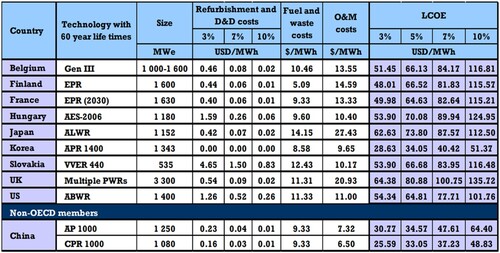
Figure 2. Overnight construction costs for nuclear power plants. Based on (Lovering, Yip, and Nordhaus Citation2016).
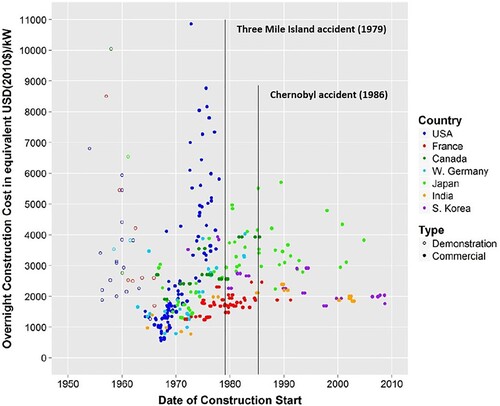
Figure 3. UK industrial heat demand per year by sector. Source: (DECC Citation2013).
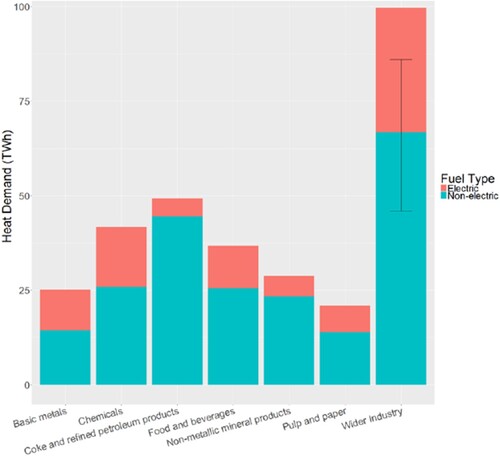
Figure 4. Temperature ranges of heat application processes and types of nuclear power plant. Source: (IEA Citation2017).
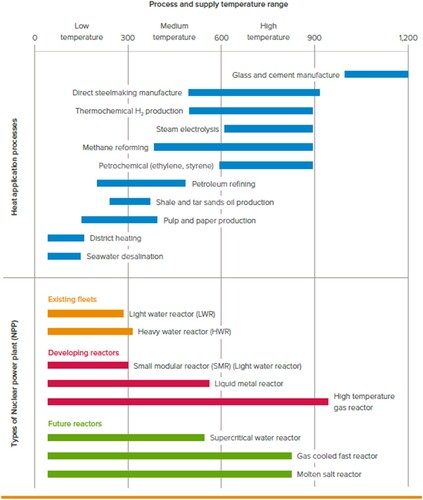
Figure 5. The approximate location of Hammerfest LNG Terminal Melkøya.
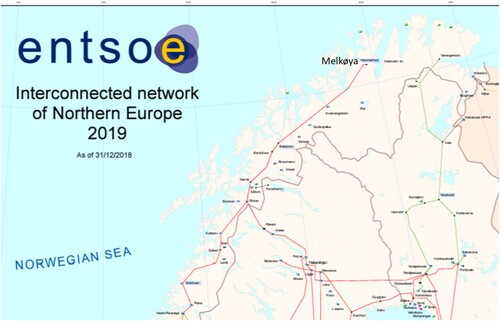
Figure 6. Illustration of the Melkøya LNG Terminal upon completion. Source: Equinor.Footnote10
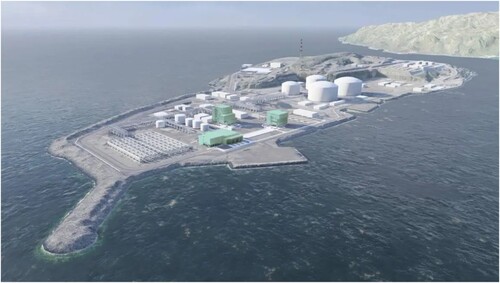
Figure 7. Hourly wind power production in N04 in 2022 [MWh/h]. The figure is made by the author using data from NVE.Footnote11
![Figure 7. Hourly wind power production in N04 in 2022 [MWh/h]. The figure is made by the author using data from NVE.Footnote11](/cms/asset/4c45a8c3-206d-42c7-83bc-024f1998fa1a/gsol_a_2260008_f0007_oc.jpg)
Figure 8. Monthly wind power production profile including uncertainty in the model.
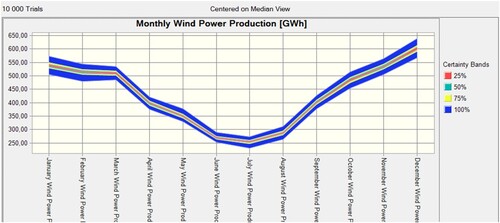
Figure 9. Monthly spot prices in SE1, N03, power intensive industry in Norway and FI.
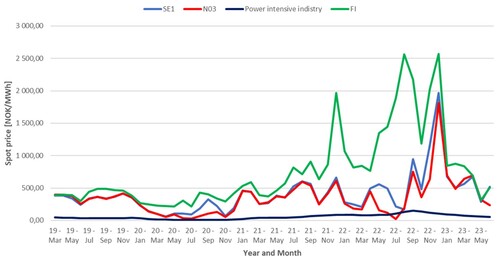
Table 1. Cost summary for the two alternatives.
Figure 10. Comparing the Total Discounted System Costs for the Wind- and for Nuclear alternatives.
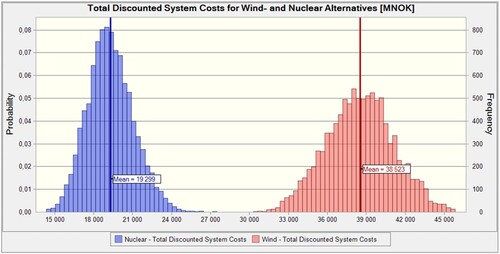
Figure 11. The usage of the 100 MW grid support and outright energy shortages.
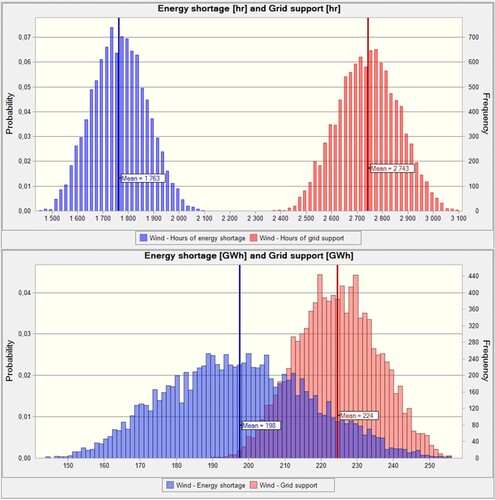
Figure 12. The discounted social opportunity cost.
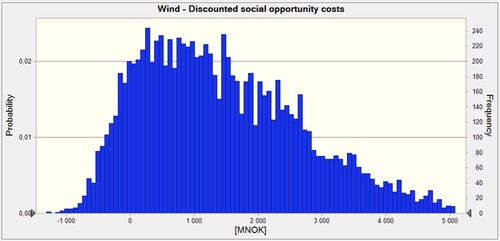
Figure 13. System LCOE [MNOK] for wind- and nuclear alterntives.
![Figure 13. System LCOE [MNOK] for wind- and nuclear alterntives.](/cms/asset/bd043510-c48a-44b0-9318-27d4618cd50a/gsol_a_2260008_f0013_oc.jpg)
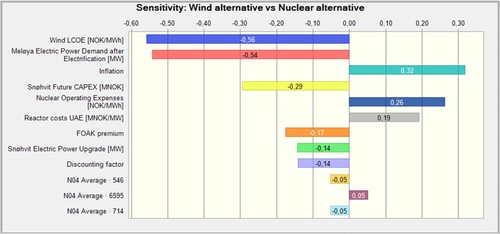
Figure 14. Uncertainty sensitivity analysis of the difference between the two alternatives.
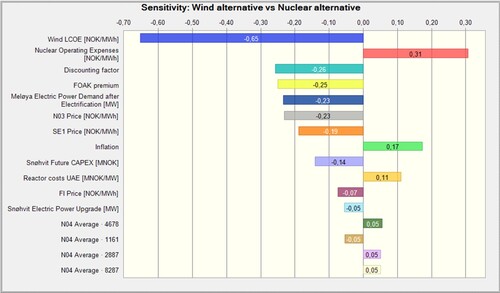
Figure 15. Tracing sensitivity analysis of the difference between the two alternatives.