
Figures & data
Table 1. Variables description.
Table 2. Descriptive statistics.
Table 3. Cross-Section dependence test results.
Table 4. Panel unit root test results.
Table 5. Results of panel VAR model.
Table 6. Granger causality test results.
Figure 1. Impulse-response graphs.
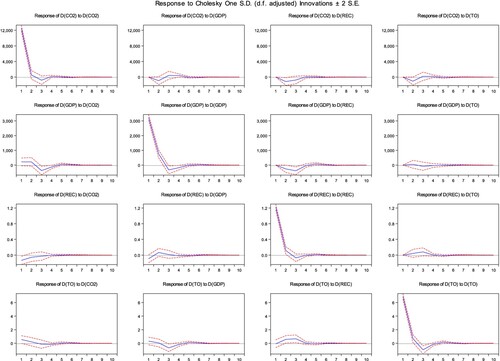
Table 7. Variance decomposition.
Data availability
The data will be made available from the corresponding author upon reasonable request.
