
Figures & data
Table 1. Effect of renewable energy consumption and capital market on carbon emission.
Figure 1. (a) Effect of renewable energy consumption on carbon emissions at levels of stock market capitalization influence of renewable energy consumption on carbon emissions at levels of stock market development.
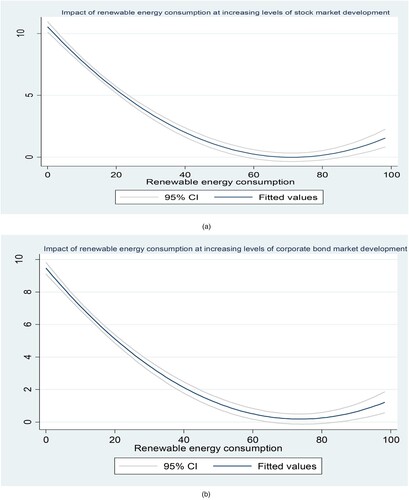
Table 2. System dynamic GMM estimation: interaction effect of renewable energy consumption, capital market and carbon emissions.
Table 3. System dynamic GMM Estimation: Impact of carbon emission and capital market on renewable energy.
Figure 2. (a) Effect of carbon emissions on renewable energy consumption at levels of stock market capitalisation influence of carbon emissions on renewable energy consumption at levels of stock market development; (b) Effect of carbon emissions on renewable energy consumption at levels of bond market issuance influence of carbon emissions on renewable energy consumption at levels of bond market development.
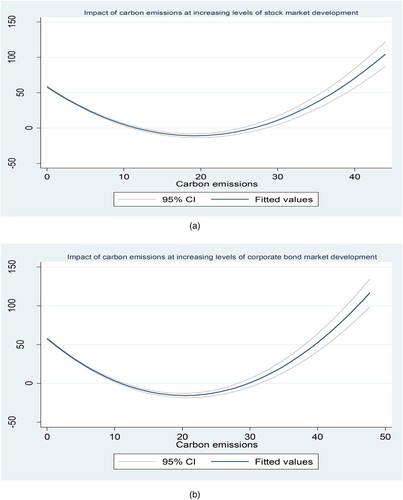
Table 4. System dynamic GMM Estimation: interaction effect of carbon emission and capital market on renewable energy.
Table A1. Measurement of control variables.
Table A2. Descriptive statistics
Table A3. Pairwise correlations
