
Figures & data
Figure 1. Map of La Guajira department depicting: (a) Geographical positions of the selected locations, and (b) Topography of the region.
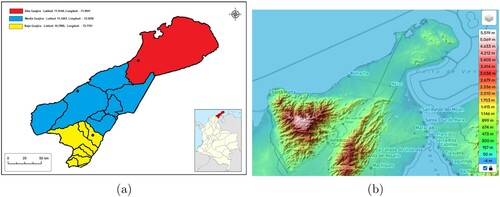
Table 1. Summary of the department's zones, selected locations, and coordinates.
Table 2. List of El Niño, La Niña, and typical year events analysed in this study.
Figure 2. Direction of the test for .
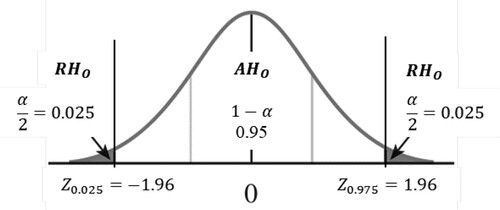
Figure 3. Histograms of solar radiation are shown for three groups of years: La Niña (Na), El Niño (No), and a typical year (T), considering the studied areas: (a) Upper Guajira, (b) Middle Guajira, and (c) Lower Guajira.
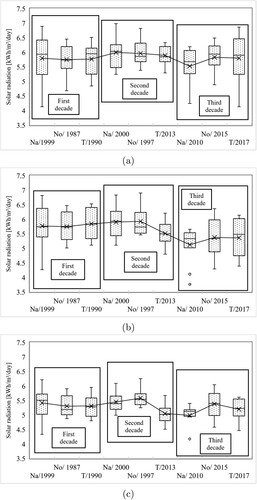
Figure A1. Time series and trend lines for the solar radiation variable are provided for La Niña (Na), El Niño (No), and a Typical Year (T) events, considering (a) the first decade, (b) the second decade, and (c) the third decade in the Upper Guajira region.
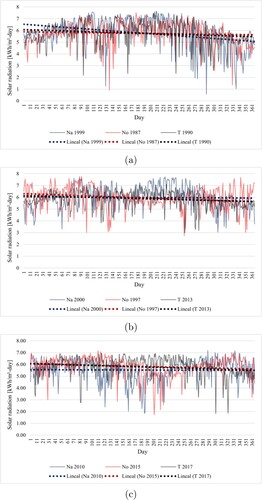
Figure A3. Time series and trend lines for the solar radiation variable are provided for La Niña (Na), El Niño (No), and a Typical Year (T) events, considering (a) the first decade, (b) the second decade, and (c) the third decade in the Lower Guajira region.
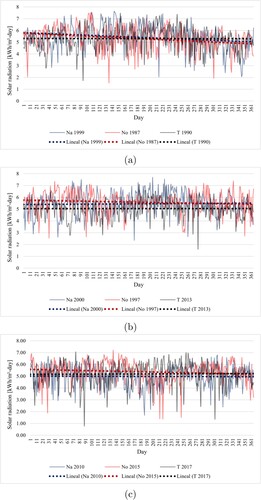
Table A1. Monthly average daily solar radiation for the three years of El Niño, La Niña, and typical year for the Upper Guajira region.
Table A3. Monthly average daily solar radiation for the three years of El Niño, La Niña, and typical year for the Lower Guajira region.
Table 3. Analysis of the test statistic of the solar radiation variable for the study areas concerning the phenomena (El Niño and La Niña) and typical year.
Figure 4. Histograms of wind speed are generated for three groups of years in which the La Niña (Na), El Niño (No), and a typical year (T) events occurred, considering the studied zones: (a) Upper Guajira, (b) Middle Guajira. and, (c) Lower Guajira.
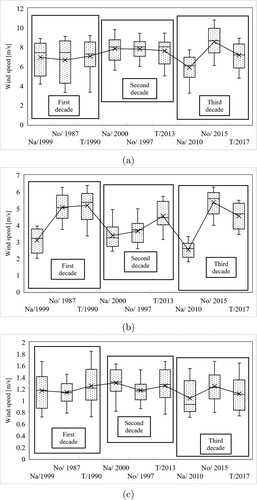
Figure A4. Time series and trend lines for the wind speed variable are presented for La Niña (Na), El Niño (No), and a Typical Year (T) events, considering (a) the first decade, (b) the second decade, and (c) the third decade in the Upper Guajira region.
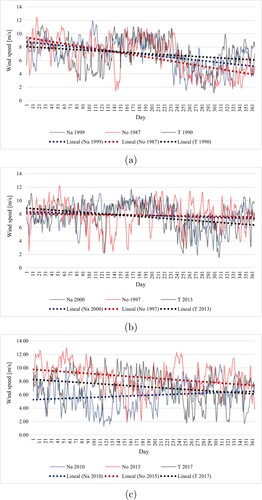
Figure A6. Time series and trend lines for the wind speed variable are presented for La Niña (Na), El Niño (No), and a Typical Year (T) events, considering (a) the first decade, (b) the second decade, and (c) the third decade in the Lower Guajira region.
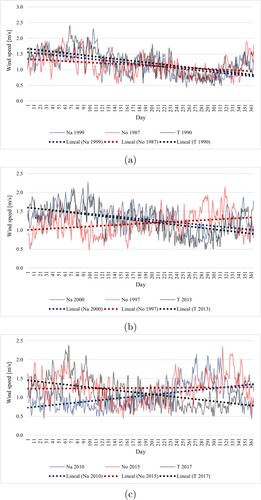
Table A4. The average monthly wind speed for the Upper Guajira zone is presented for the three years of El Niño, La Niña, and a typical year.
Table A6. The average monthly wind speed for the Lower Guajira zone is presented for the three years of El Niño, La Niña, and a typical year.
Table 4. The test statistic of the wind speed variable was analysed for the study areas in relation to the phenomena of El Niño, La Niña, and a typical year.
Figure 5. Correlations between the ONI and solar radiation are examined across three distinct groups of years representing La Niña events (Na), El Niño events (No), and typical years (T). These analyses are conducted while considering the specific regions under study: (a) Upper Guajira, (b) Middle Guajira, and (c) Lower Guajira.
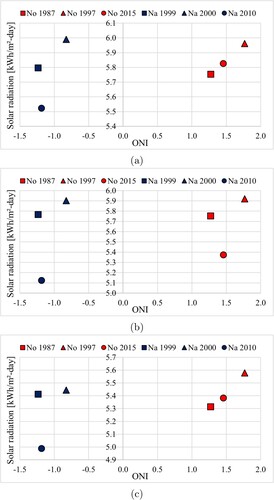
Figure 6. Correlations between the ONI and wind speed are investigated across three distinct groups of years representing La Niña events (Na), El Niño events (No), and a typical year (T). These analyses take into consideration the studied regions: (a) Upper Guajira, (b) Middle Guajira, and (c) Lower Guajira.
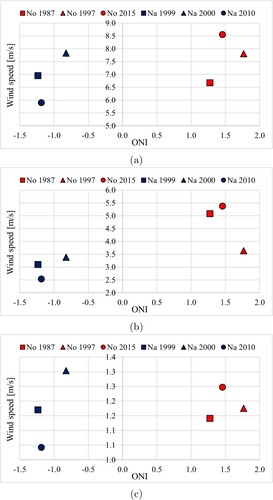
Figure A2. Time series and trend lines for the solar radiation variable are provided for La Niña (Na), El Niño (No), and a Typical Year (T) events, considering (a) the first decade, (b) the second decade, and (c) the third decade in the Middle Guajira region.
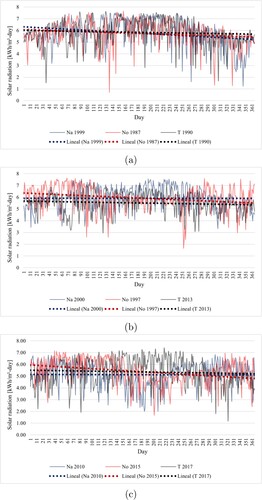
Figure A5. Time series and trend lines for the wind speed variable are presented for La Niña (Na), El Niño (No), and a Typical Year (T) events, considering (a) the first decade, (b) the second decade, and (c) the third decade in the Middle Guajira region.
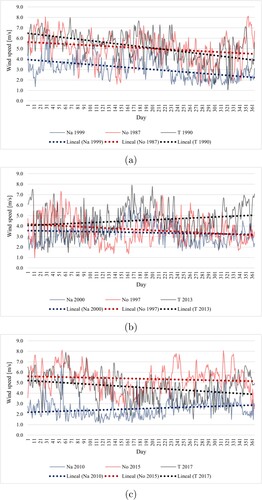
Table A2. Monthly average daily solar radiation for the three years of El Niño, La Niña, and typical year for the Middle Guajira region.
Table A5. The average monthly wind speed for the Middle Guajira zone is presented for the three years of El Niño, La Niña, and a typical year.
