
Figures & data
Figure 1. Methodology for stakeholder analysis using an MCDA approach.
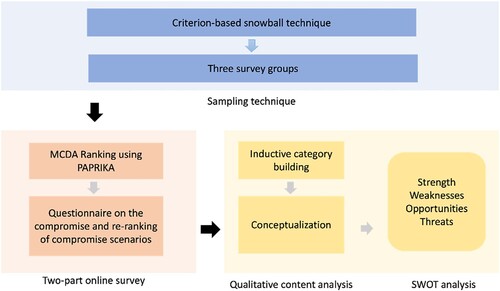
Table 1. Characteristics of survey groups.
Table 2. Number of respondents in the three survey groups for the first part survey. Stakeholders could also select more than one category. Therefore, the numbers do not add up to the total number of respondents. During the second part survey, participation changed slightly, but overall consultation remained.
Figure 2. Case situation of th
e scenario framework taken from Weber, Steinkamp, and Reichenbach (Citation2023). Identified areas for wind energy only embrace 1.67% of the region’s area, leaving a delta to meet the state-specific area targets of 2.2%, values according to Regionale Planungsgemeinschaft Havelland-Fläming (Citation2020).
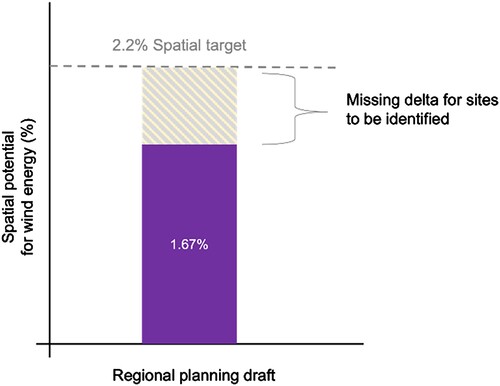
Table 3. Criteria used in this scenario-MCDA, which have been derived from the scenario framework by Weber, Steinkamp, and Reichenbach (Citation2023). The cliparts were previously published in Weber, Steinkamp, and Reichenbach (Citation2023).
Table 4. Criteria, criteria levels and combined scenarios to only close the gap (‘delta’) for spatial wind energy target achievement of 2.2% of the regional area, on the basis on multi-criteria scenarios from Weber, Steinkamp, and Reichenbach (Citation2023). The arrow indicates how to read the table.
Figure 3. Indirect weighing of two criteria each using the PAPRIKA method and the software 1000 minds. Percentages indicate the percentage of land (criterion) required for wind (or solar) energy per scenario to meet the spatial wind energy target of 2.2%.
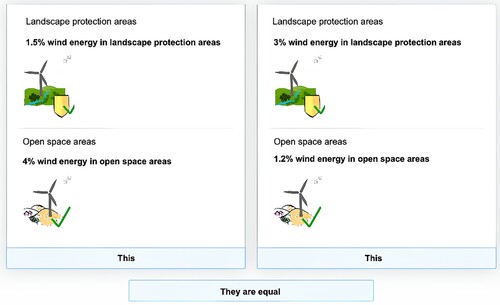
Figure 4. Ranking of scenarios and preference values for scenarios for the three survey groups. The lower the preference value, the more is the preference for the scenario.
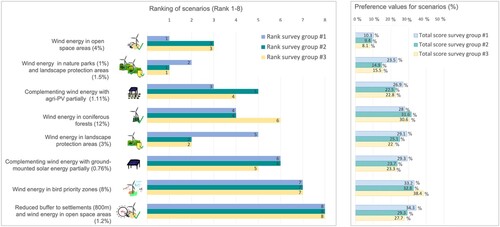
Figure 5. Preferred criteria for wind energy development across the three survey groups
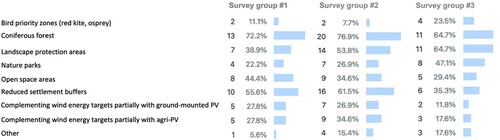
Figure 6. Acceptance of stakeholders’ own ranking of the scenarios in each survey group using PAPRIKA (left). For stakeholders indicating dissatisfaction with criteria applied, the named criteria a visualised in a word cloud in total. The bigger the word, the more often this criterion is rejected across all survey groups (right).
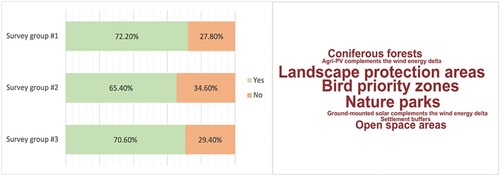
Figure 7. Results and arguments regarding opinions on ranking and willingness to compromise. The bubbles show the percentage of agreement (green) or disagreement (orange) with the questions. The word clouds display the most frequently cited arguments. The larger the word, the more times it was mentioned.
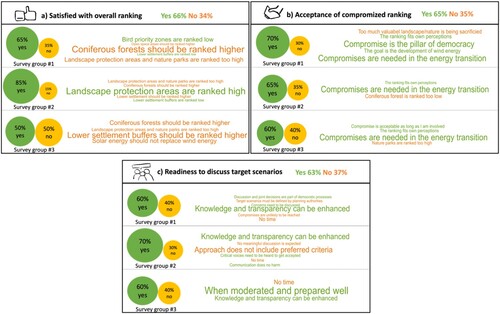
Table 5. Cross-table of satisfaction and acceptance of ranking across stakeholder sectors. Red frames and shaking hands symbols indicate sectors that are willing to compromise despite dissatisfaction with the ranking (12.9%). Grey frames and lightning bolts indicate sectors that value own perceptions (35.49%).
Figure 8. Results and arguments regarding perception of the process, satisfaction and transparency. The bubbles show the percentage of agreement (green) or disagreement (orange) with the questions. The word clouds display the most frequently cited arguments. The larger the word, the more times it was mentioned.
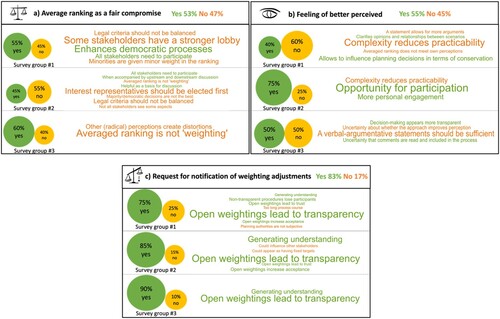
Table 6. Cross-table on whether stakeholders imagine the scenario process as part of a real planning process. Green frames indicate a preference for scenario processes within sector groups. Orange frames indicate disapproval.
Figure 9. Results and arguments regarding external obstacles and practicability. The bubbles show the percentage of agreement (green) or disagreement (orange) with the questions. The word clouds display the most frequently cited arguments. The larger the word, the more times it was mentioned.
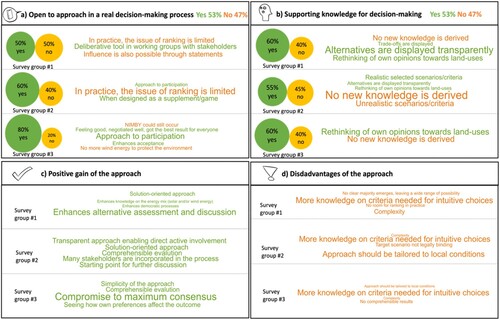
Table 7. SWOT analysis and patterns of argumentations, indicating four stakeholder groups toward compromise.
