
Figures & data
Figure 1. Schematic representation of (a) VUT-1000C biogas pilot plant coupled to an electricity generator and (b) STH-1000A digester (Khune Citation2021).
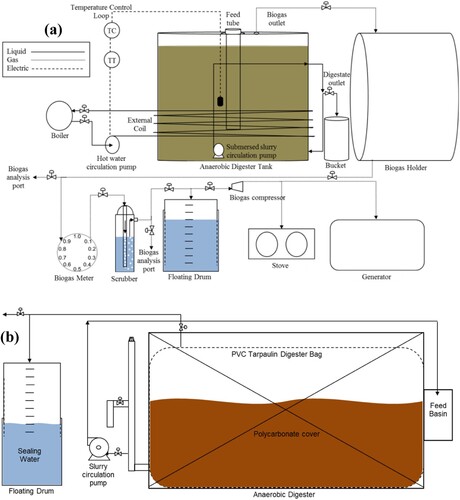
Table 1. Characteristics of CD and FW (Khune Citation2021).
Figure 2. Daily (a) and cumulative (b) biogas production, biogas composition (c), and digester pH (d) during VUT-1000C biodigester start-up (Khune Citation2021).
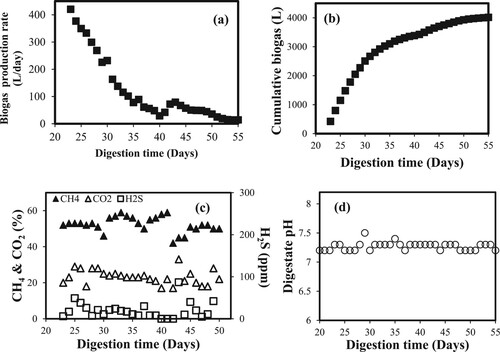
Figure 3. (a) Biogas and (b) methane hourly production rate, and cumulative (c) biogas and (d) methane production during anaerobic digestion of food waste at different organic loading rates (kgVS/m3/day) (Khune Citation2021).
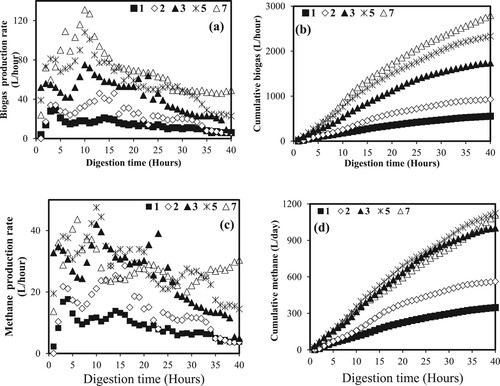
Figure 4. Specific biogas and methane yields during food waste at different organic loadings in VUT-1000C (Khune Citation2021).
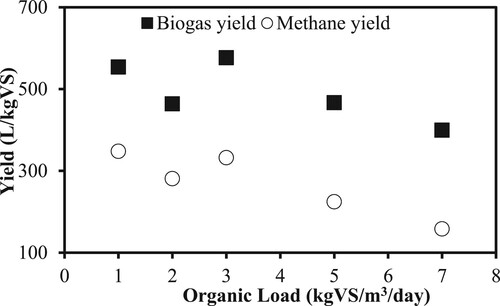
Figure 5. Daily biogas and methane production during food waste treatment using VUT-1000C (a) and STH-1000A (b) bioreactors at optimum conditions (Khune Citation2021).
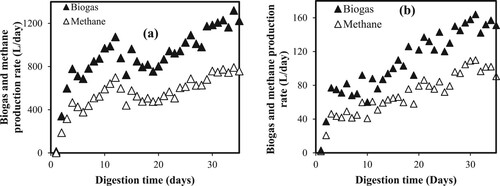
Figure 6. Digester temperature during food waste digestion using VUT-1000C (a) and STH-1000A (b) (Khune Citation2021).
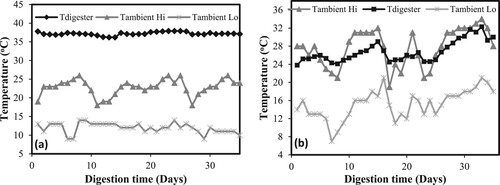
Table 2. Power consumption of equipment used in biogas production and biogas use.