Figures & data
Figure 1. Schematic of central heating system.
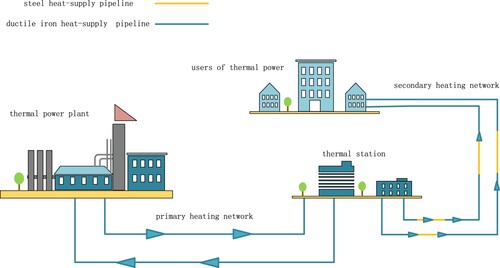
Figure 2. Directly buried steel hot water pipe.
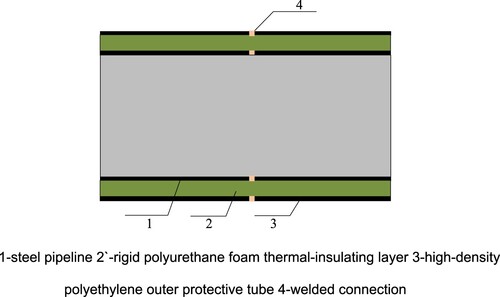
Figure 3. (a) Structure of directly buried ductile iron heat-supply pipeline (b) socket connection structure.
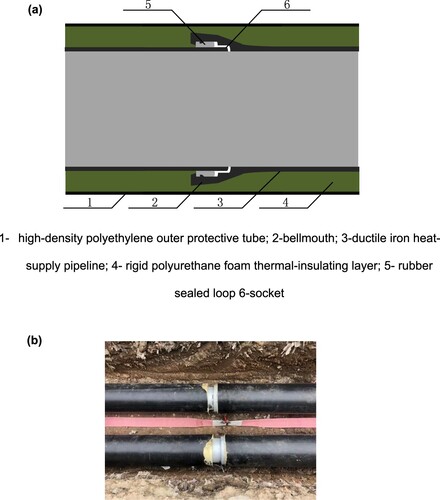
Figure 4. Model building system diagram.
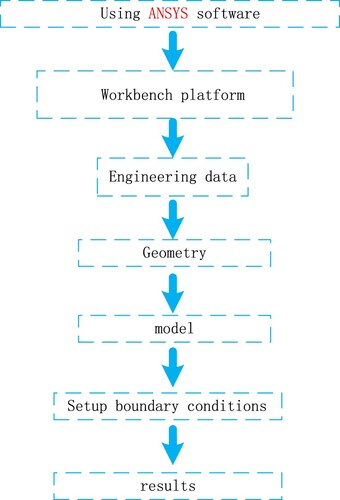
Figure 5. Geometrical dimensions of ductile iron pipe.
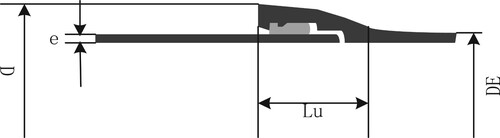
Table 1. Pipe geometry of each pipe diameter.
Figure 6. Pipe geometry model.
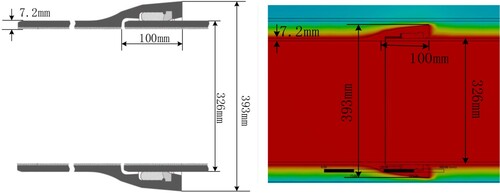
Figure 7. Three-dimensional model.
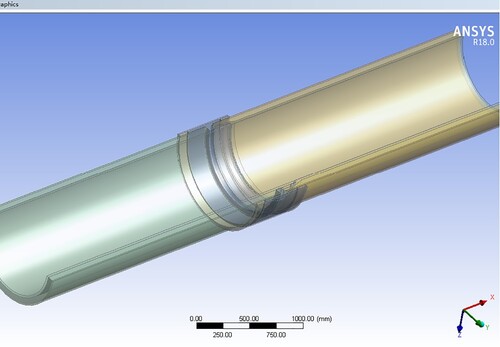
Figure 8. Boundary conditions for the heat transfer analysis of two-line heat-supply pipeline buried directly under the soil.
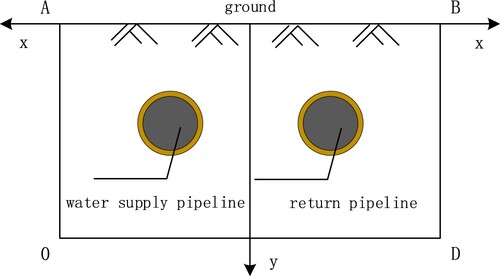
Figure 9. (a) Layer-wise temperature distribution of soil in different months (b) Monthly distribution of temperature at different burial depths.
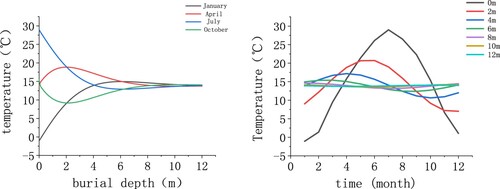
Figure 10. (a) Position diagram of adiabatic surface (b) Temperature distribution along x-axis with different burial depths; (c) simulation of temperature field in the calculation domain.
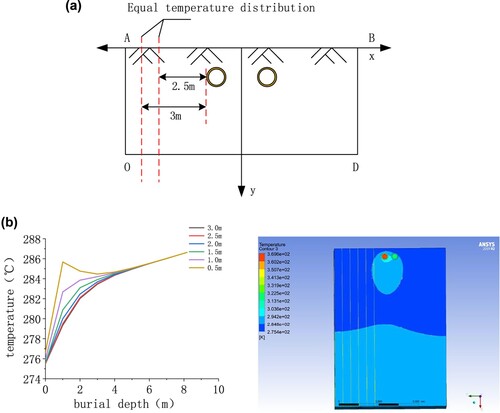
Figure 11. Grid independence check result curve.
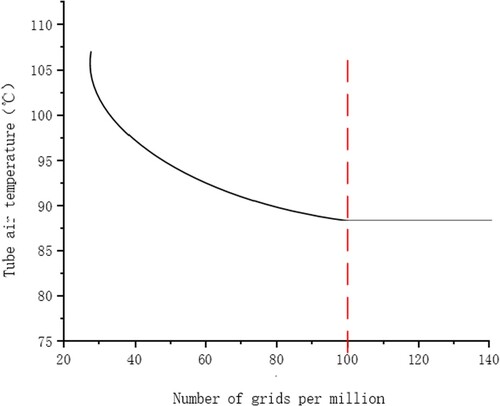
Figure 12. ANSYS simulation model of pipe main body part.
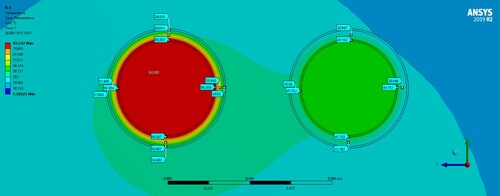
Figure 13. Testing section at the interface.
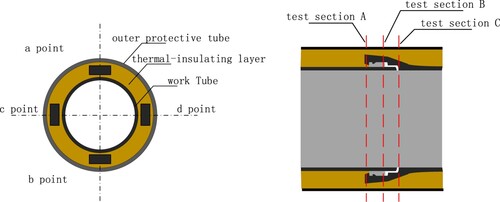
Figure 14. Experimental line experimental platform.
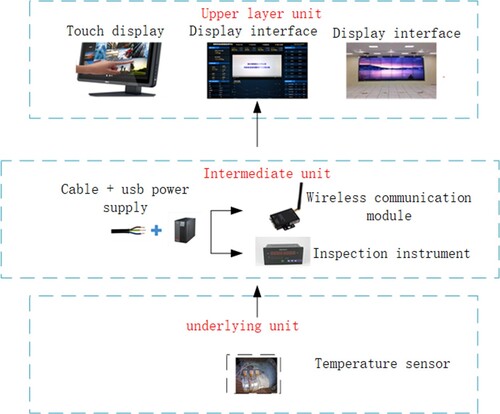
Figure 15. Experimental data module Settings.
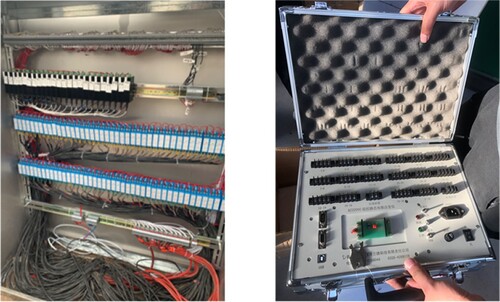
Figure 16. Temperature sensor.
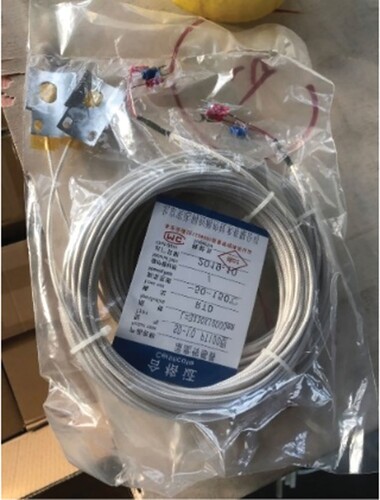
Table 2. Temperature of water supply and return pipes under 11 specific working conditions.
Figure 17. Temperature numerical solution and experimental value of main body of water supply pipeline.
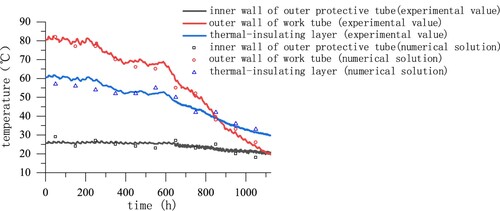
Figure 18. Temperature distribution on outer wall of outer protective tube under a thermal-insulating layer thickness of 40 mm.
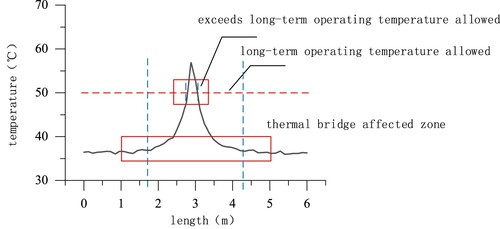
Figure 19. Temperature distribution of outer surface of the DN300 outer protective pipe.
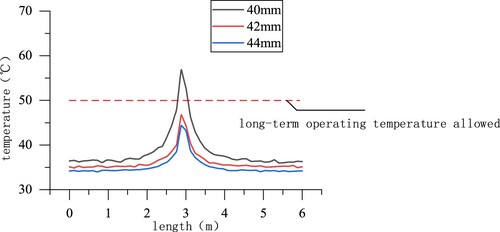
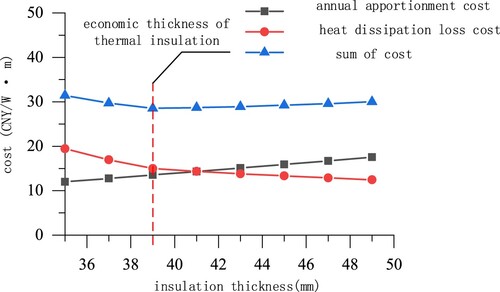
Figure 20. Economic thickness of thermal-insulating layer (in absence of thermal bridge effect).
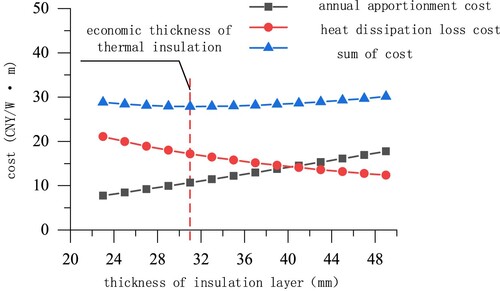
Figure 21. Economic thickness of thermal-insulating layer (in presence of thermal bridge effect).