Figures & data
Figure 1. Annual fuel Consumption of 2W (left) and 4W (right) vehicles in India.
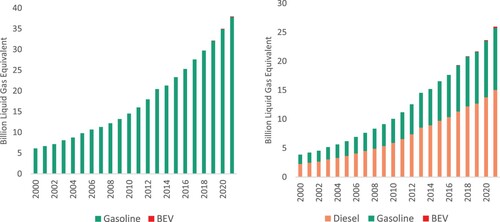
Figure 2. Soft linking framework used to combine the transport model, demand model, and power model to collectively assess the energy and environmental implications of changes in India's transportation and power sectors.
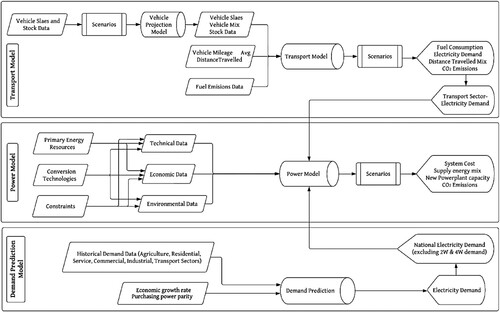
Table 1. Transport model (TM) scenarios.
Table 2. Power model (PM) scenarios.
Figure 3. Estimated growth of 2W and 4W vehicles in India, presented in millions of vehicles for years 2020–2050. The projections are analysed across three distinct scenarios, BAU (Stated Policy Scenario), APS (Announced Pledges Scenario) and HAS (High Ambitious Scenario).
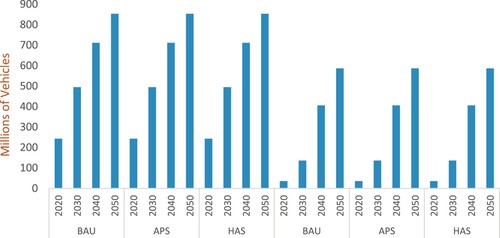
Figure 4. Fuel mix used by 2W and 4W vehicles in India across three distinct scenarios, BAU (Stated Policy Scenario), APS (Announced Pledges Scenario) and HAS (High Ambitious Scenario).
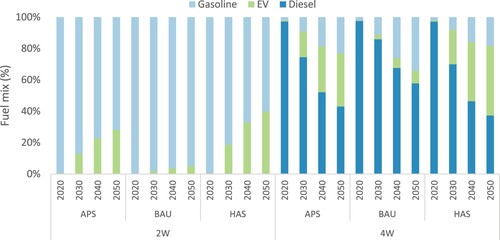
Figure 5. Combined CO2 emissions attributed to 2W and 4W vehicles in India across three distinct scenarios, BAU (Stated Policy Scenario), APS (Announced Pledges Scenario) and HAS (High Ambitious Scenario).
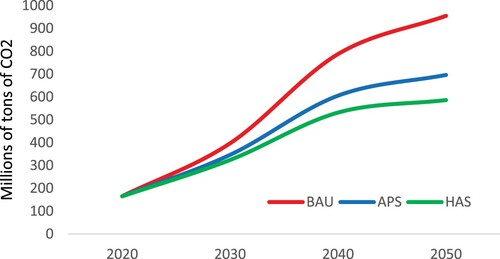
Figure 6. Power demand required for charging 2W and 4W EVs in TWh in India across three distinct scenarios, BAU (Stated Policy Scenario), APS (Announced Pledges Scenario) and HAS (High Ambitious Scenario).
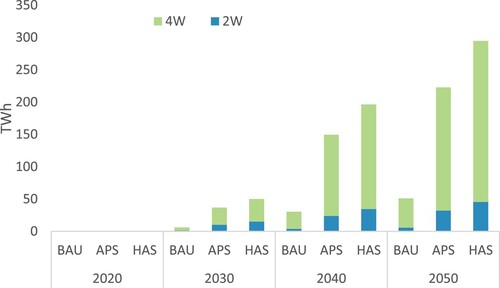
Table 3. Demand prediction model output.
Figure 7. Fuel mix utilised to meet the power demand of the transportation sector in India, focusing on 2W & 4W in three distinct scenarios, BAU (Stated Policy Scenario), APS (Announced Pledges Scenario) and HAS (High Ambitious Scenario).
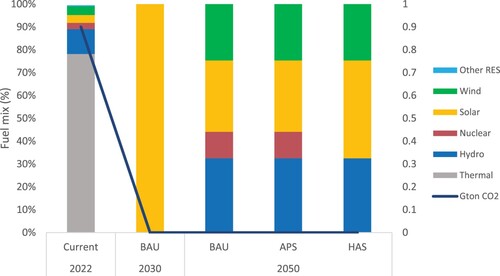
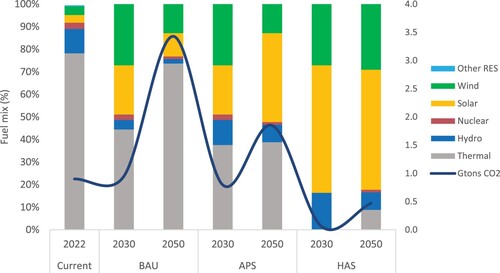
Figure 8. Composition of the energy sources or fuel types used to meet the national power demand in India in three distinct scenarios, BAU (Stated Policy Scenario), APS (Announced Pledges Scenario) and HAS (High Ambitious Scenario).