Figures & data
Figure 1. Yearly distribution of exported power Pgij (a) and imported power Pcij (b) in kW of the household No. 1. Total installed power – 4 kW.
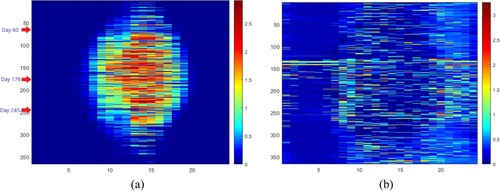
Figure 2. Yearly distribution of exported power Pgij (a) and imported power Pcij (b) in kW of the household No. 5. Total installed power – 15 kW.
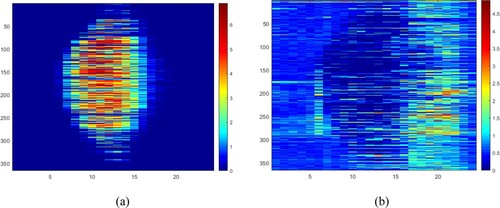
Figure 3. Yearly distribution of exported power Pgij (a) and imported power Pcij (b) in kW of the household No. 8. Total installed power – 20 kW.
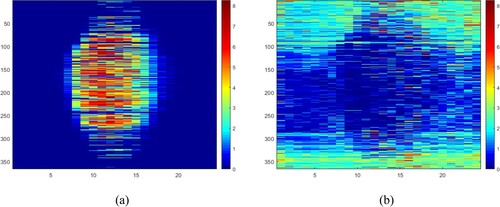
Figure 4. A detailed view of imported power Pcij (blue columns) and exported power Pcij (red columns) distribution during certain days: 60th (a), 176th (b) and 245th (c).
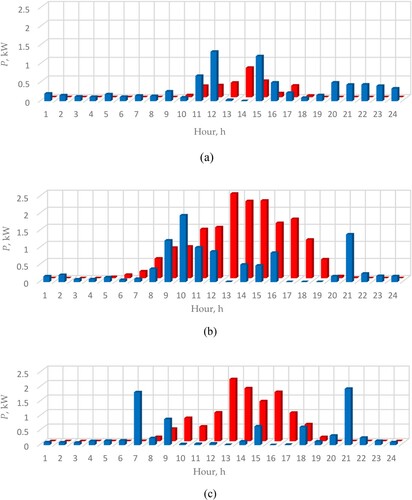
Figure 5. Comparison between the measured imported power Pcij (a) and the optimised imported power (b) in kW over the year.
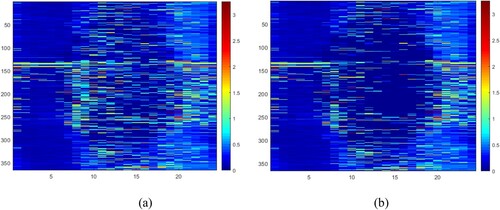
Figure 6. A detailed view of measured imported power Pcij (blue columns) and optimised imported power (green columns) during the three aforementioned days: 60th (a), 176th (b) and 245th (c).
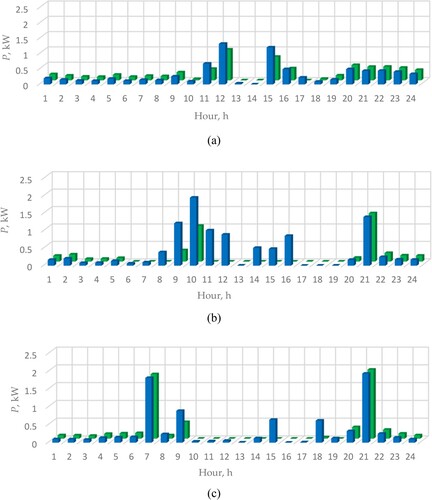
Figure 7. Calculated optimised imported power (green columns) and optimised exported power
(orange columns) over the three days of the year: 60th (a), 176th (b) and 245th (c).
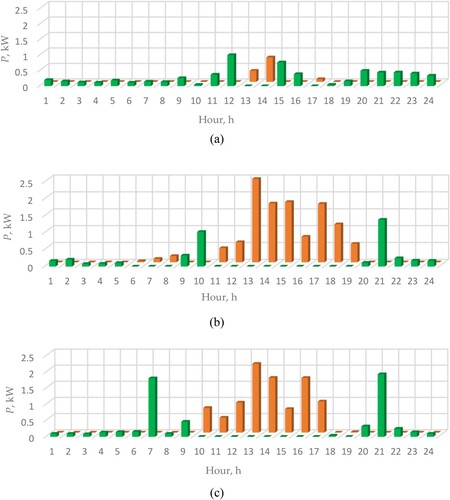
Table 1. Analytical data for the three days of the household from .
Table 2. Analytical data of household power import/export during the year of 2020.
Figure 8. The distribution of parameter r0Dj during the year for household No. 1 (a) and household No. 8 (b).
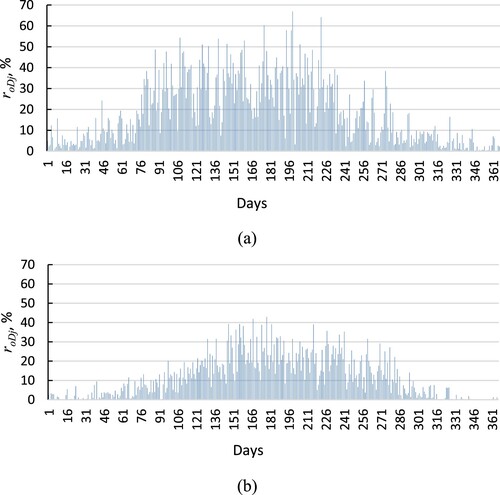
Figure 9. Scheme of experiment equipment arrangement.
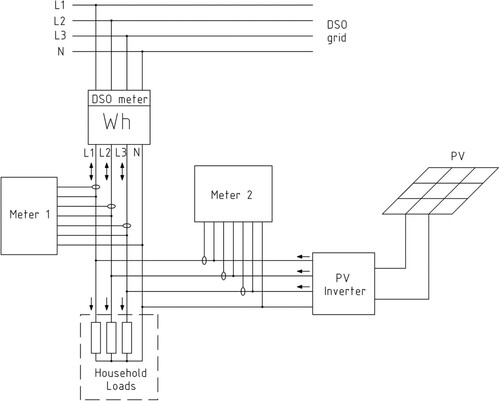
Figure 10. Generated power in each power line during one day.
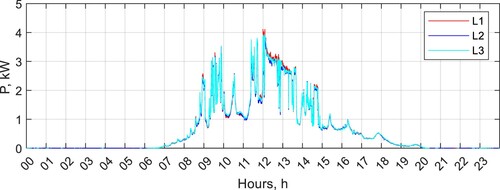
Figure 11. Consumed power in three power lines: L1 (a), L2 (b) and L3 (c).
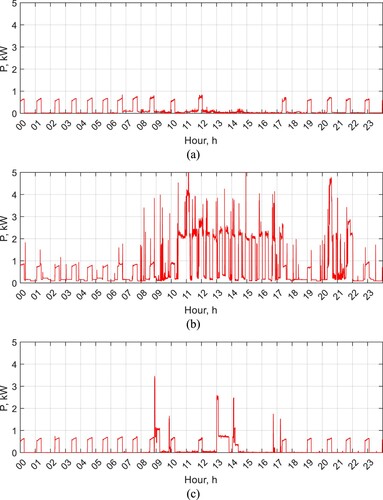
Figure 12. Daily imported (red line) and exported (blue line) power in power lines L1 (a), L2 (b) and L3 (c).
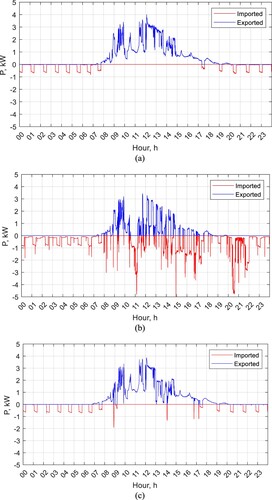
Figure 13. Example of power flows switching in three-phase microgrid during 1-min time interval.
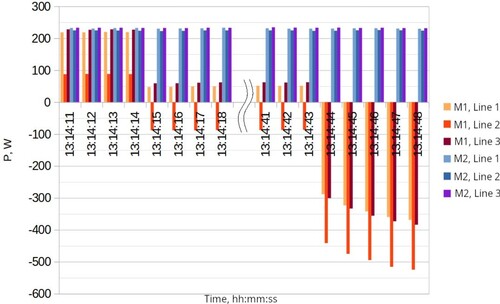
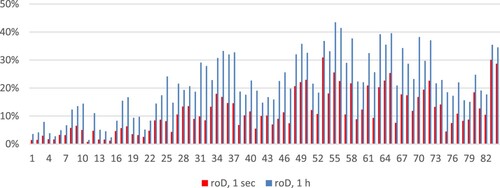
Figure 14. Distribution of calculated parameter using 1-h time resolution data (blue columns) and one-second time resolution data (red columns) during 82-day period.