
Figures & data
Figure 1. Different OWT support structures and foundation concepts (Kirkwood, Haigh, and Bhattacharya Citation2014).
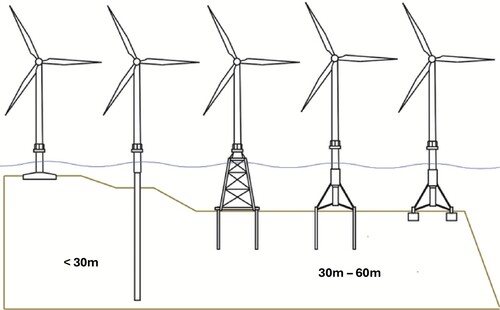
Figure 2. Flowchart of Reliability-Constrained Design optimisation framework.
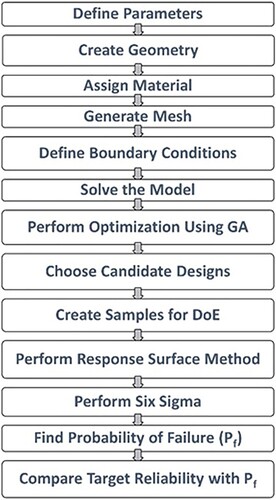
Figure 3. Reference model geometry and dimensions.
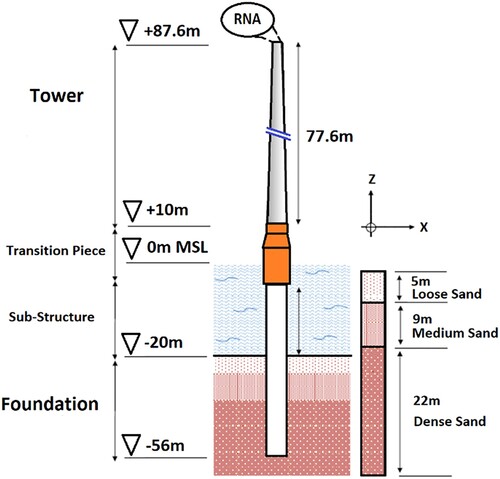
Table 1. NREL 5 MW baseline wind turbine (Jm. Jonkman et al. Citation2009).
Table 2. Wave load assumption and values.
Figure 4. Applied loads on OWT support structure.
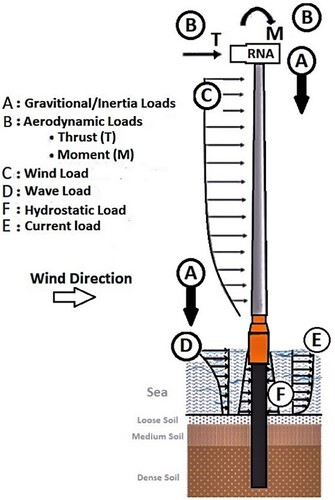
Table 3. Wind turbine aerodynamic loads, (Jm. Jonkman et al. 2009).
Table 4. Design load cases, (IEC Citation2005).
Figure 5. NREL 5MW wind turbine and OC3 platform geometry.
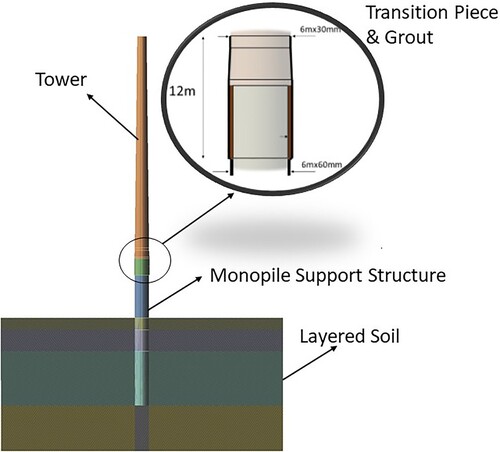
Figure 6. Isometric view of geometry and applied loads.
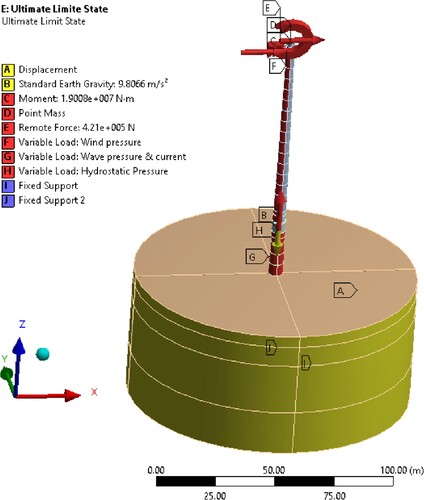
Table 5. Sand properties in different levels (Jung et al. Citation2015).
Table 6. Support structure material properties.
Figure 7. Final generated mesh.
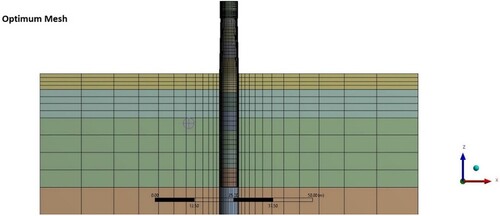
Table 7. Mesh sensitivity.
Table 8. Deformation in the reference model and current model.
Figure 8. Design variables of OWT support structure.
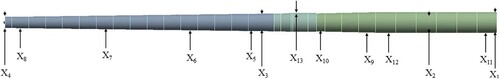
Figure 9. Illustration of typical excitation ranges of a modern OWT (Kallehave et al. Citation2015).
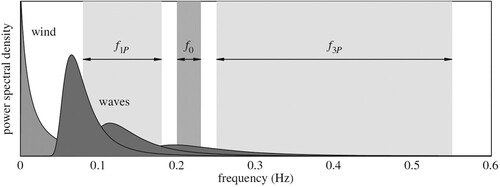
Table 9. Settings of GA.
Table 10. Design Variables (Jm. Jonkman et al. 2009).
Figure 10. FEA DO analysis results for design candidate 1, (a) Von Mises equivalent stress, (b) Buckling deformation, (c) mudline displacement, (d) Total deformation, (e) 1st mode frequency and displacement, (f) Fatigue minimum safety factor.
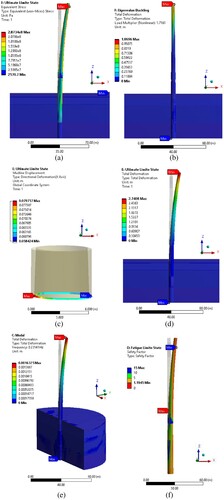
Table 11. Deterministic optimisation results.
Figure 11. Global sensitivity analysis.
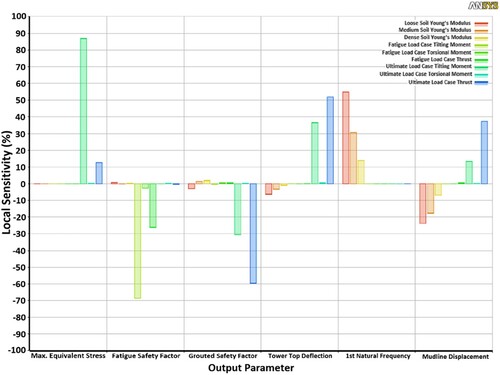
Figure 12. Cumulative density function and probability density function of design candidate 1 for (a) Fatigue minimum safety factor; (b) Equivalent stress maximum; (c) First natural frequency; (d) Buckling load multiplier; (e) Total deflection.
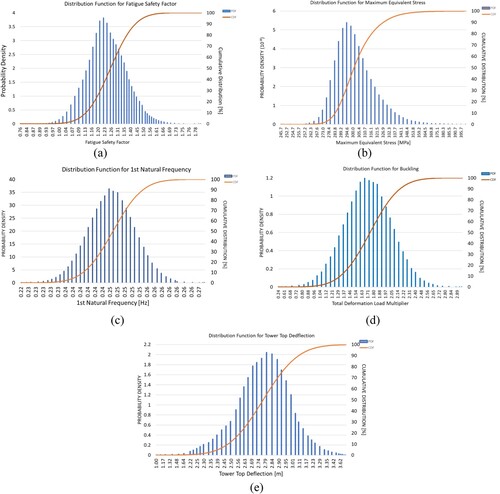
Table 12. Reliability-Constrained analysis result.