
Figures & data
Figure 1. Kuwait's map showing the planned land use as outlined in Kuwait’s 4th master plan (Dar Al-Handasah Citation2024).
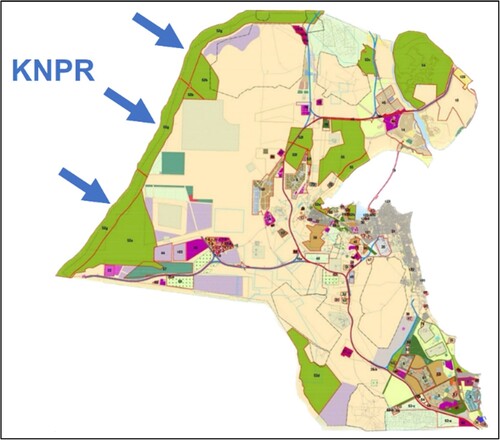
Figure 2. Flowchart of the sequential steps of the methodology used in this paper.
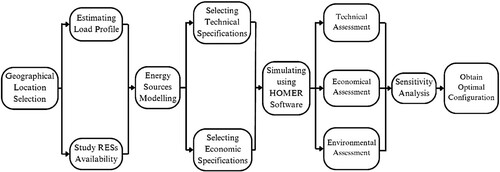
Figure 3. Proposed system diagram for KNPR using HOMER® software showing major components.
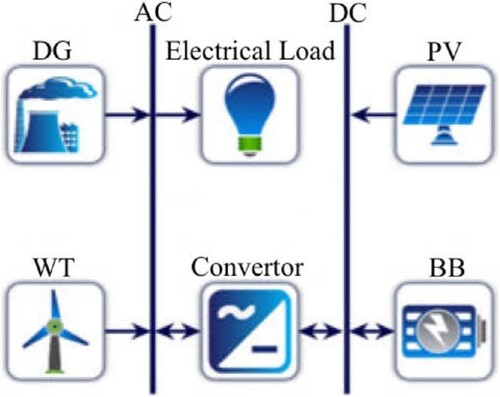
Figure 4. Daily load profile of KNPR during typical (a) summer, and (b) winter days.
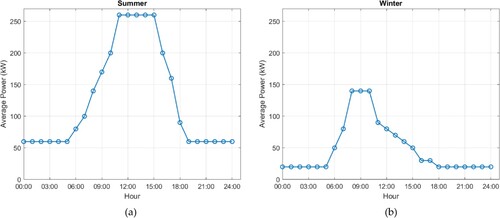
Table 1. KNPR estimated load power and energy calculations during typical summer and winter days.
Figure 5. Monthly weather data of KNPR showing average daily (a) solar irradiance, and (b) wind speed at 50 m (NASA Langley Research Center Citation2024).
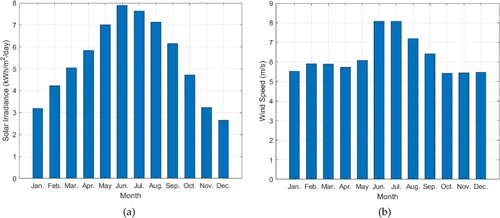
Table 2. SunPower X21-335-BLK PV panels datasheet (SunPower Corporation Citation2024).
Table 3. Eocycle EO20 WT datasheet (Eocycle Citation2024).
Figure 6. Eocycle EO20 WT power curve showing the cut-in, cut-out, rated speeds, and the rated power (Eocycle Citation2024).
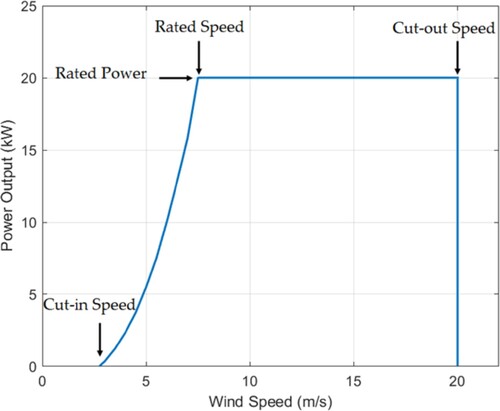
Table 4. Datasheet of the generic DG used in the proposed design (UL Solutions Citation2024).
Table 5. GHG emissions of the generic DG used in the proposed design (UL Solutions Citation2024).
Table 6. Lithium-ion batteries datasheet (UL Solutions Citation2024).
Table 7. Generic converter datasheet (UL Solutions Citation2024).
Table 8. Considered hybrid systems configurations showing component's sizes.
Figure 7. Technical assessment (energy generation distribution) for each hybrid configuation.
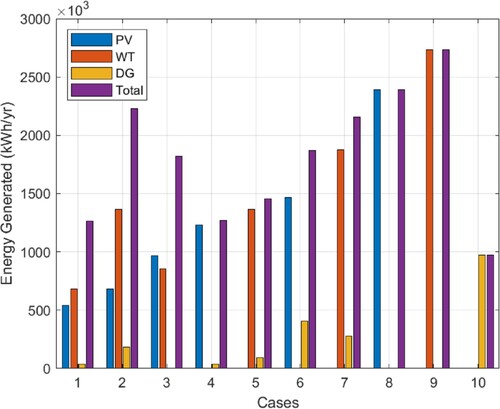
Table 9. Technical assessment (energy generation distribution) for each hybrid configuration.
Figure 8. Economic assessment showing (a) NPC, CAPEX, and OPEX, and (b) LCOE for each hybrid configuation.
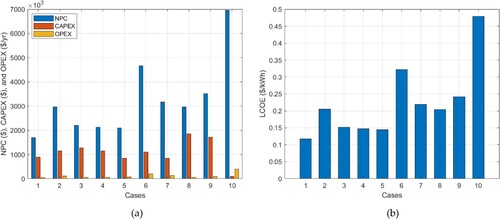
Table 10. Economic assessment for each hybrid configuation.
Figure 9. Environmental assessment showing (a) fuel consumption, and (b) CO2 and total GHG emissions for each hybrid configuation.
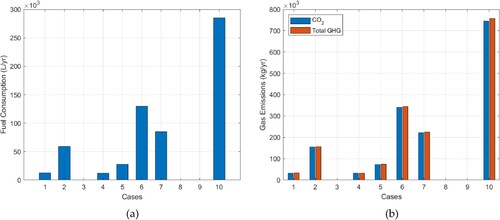
Table 11. Environmental assessment for each hybrid configuation.
Figure 10. Optimal configuration (No. 3. PV-WT-BB) electrical generation dispatch in MWh.
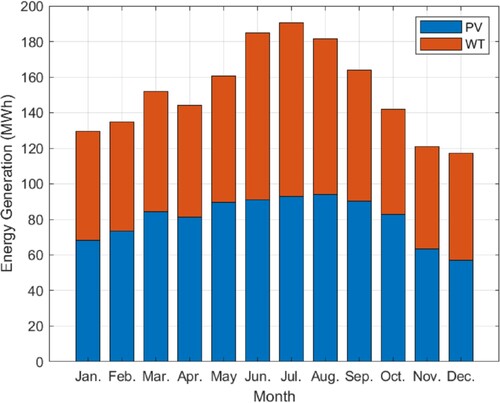
Figure 11. Weather data at KNPR showing (a) solar irradiance and cell temperature, (b) wind speed for a typical summer day (July 19), (c) solar irradiance and cell temperature, and (d) wind speed for a typical winter day (December 23).
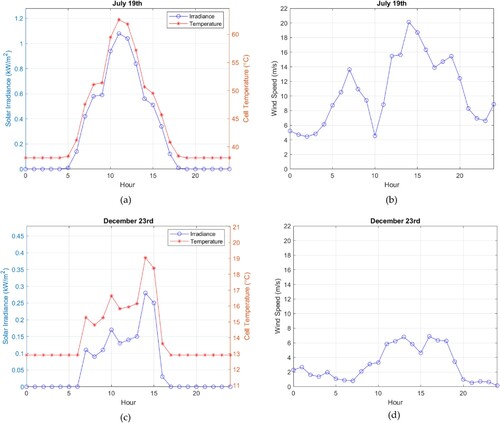
Figure 12. Hourly analysis for the optimal HRES configuration no. 3 (PV-WT-BB) showing (a) electrical generated power and load served, (b) BB energy status for a typical summer day (July 19th), (c) electrical generated power and load served, and (d) BB energy status for a typical winter day (December 23rd).
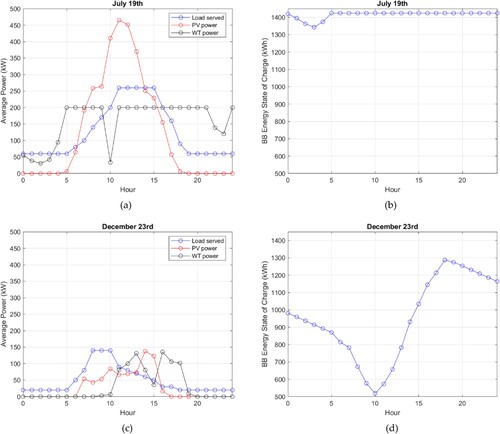
Figure 13. Cumulative cash flow in US dollar for both DG and PV-WT-BB configurations over the project’s lifetime.
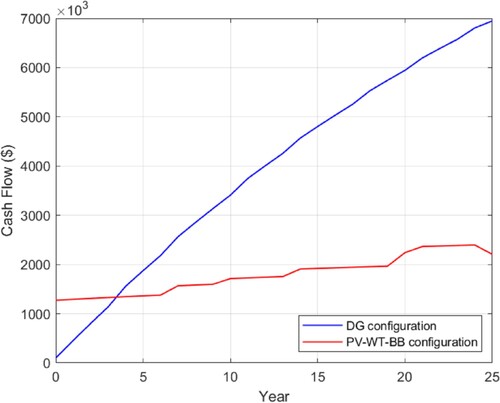
Table 12. Cost breakdown of the PV-WT-BB configuration based on cost type and component over the project lifetime.
Table 13. Comparison between optimal HRES configuration and base case of DG.
Table 14. Sensitivity analysis performed on optimal HRES configuration (PV-WT-BB) by only varying number of WTs.
Table 15. Sensitivity analysis performed on optimal HRES configuration (PV-WT-BB) by only varying PV capacity.