Figures & data
Figure 1. Net installed power capacity in Germany 2002–2023. Data source: Energy-Charts.info.
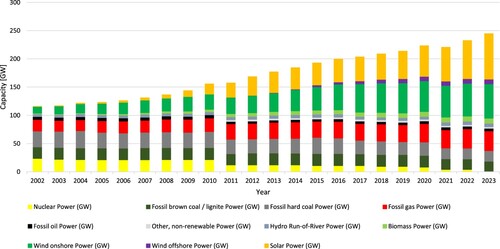
Figure 2. Annual changes in net capacity in Germany 2003–2023. Data source: Energy-charts.info.
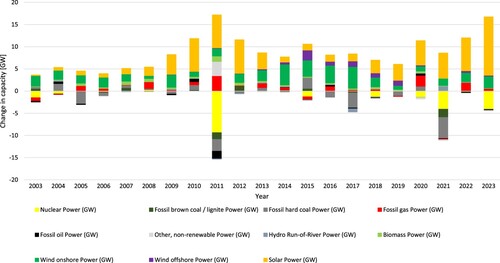
Table 1. Capacities in the German grid 2002–2022. Data source: Energy-Charts.info.
Table 2. Annual direct expenditures related to wind power and solar power in Germany 2002–2022 in nominal billion USD. Source: Author’s calculations based on data from (IRENA Citation2023). Onshore wind uses numbers from Europe whereas offshore wind and solar power are German numbers. The expenditures are nominal numbers since detailed numbers for every year is not available. The expenditures early in the period are therefore understated due to lack of inflation adjustment. For example, CAPEX of 42.6 bn USD in 2002 would give a much higher amount of adjusted to 2022 numbers. However, the exact project execution profile of the investment decisions in 2002 are unknown and can deviate substantially over years, which implies that the analysis is conservative. Also note that the CAPEX is the cashflow in a specific year and these expenditures are not depreciated over time to reflect costs. For example, the 42.6 bn USD CAPEX will probably be depreciated over 20 years giving an annual cost related to the equipment of roughly 2 bn USD. Due to different accounting rules in different countries, it is therefore best to work with expenditures as cashflow and not cost. Unfortunately, that makes any conversion into the cost of power more difficult, but that is not the topic of this paper.
Figure 3. Electricity production in Germany from 2001 through 2022. Source: Statista.
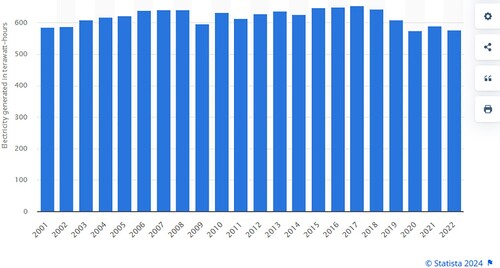
Figure 4. Total burden of taxes, fees and levies in bn euros excluding VAT. Data source: (BDEW Citation2023).
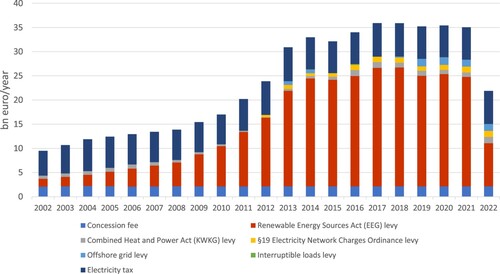
Figure 5. GHG emissions in Germany 2002–2021. Source: Our World in Data.
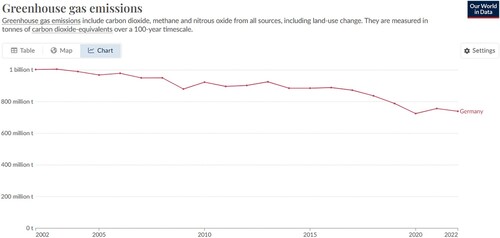
Figure 6. CAPEX and OPEX uncertainty distributions derived from .
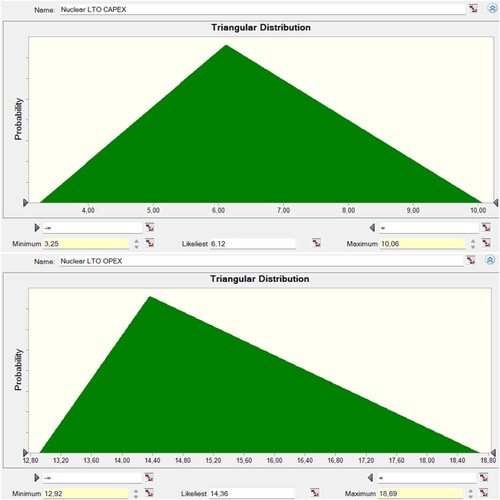
Table 3. Operation, maintenance and fuel costs for NPPs at LTO. Source: IAE LCOE Calculator.
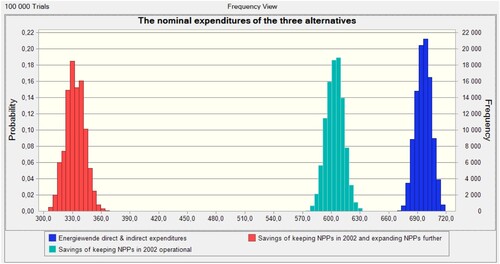
Figure 7. The savings of keeping the 2002 NPPs operational compared to the Energiewende policy.
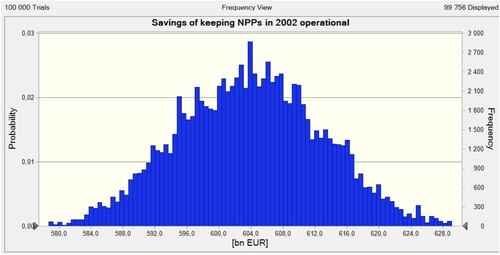
Table 4. Investment alternatives to illustrate ideal solution space; Olkiluoto 3 and Barakah.
Table 5. New German Average NPPs built in the tempo of China but scaled to match overall energy system investments.
Figure 8. Nuclear versus Energiewende. Authors calculations.
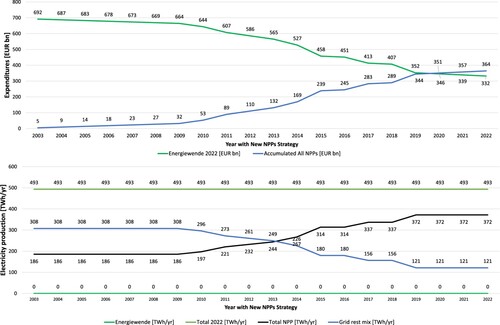
Figure 9. The expenditure of Energiewende and possible savings of alternatives policies with uncertainty.