Figures & data
Figure 1. Schematic illustration of MoSe2/La2O3 heterostructure fabrication.
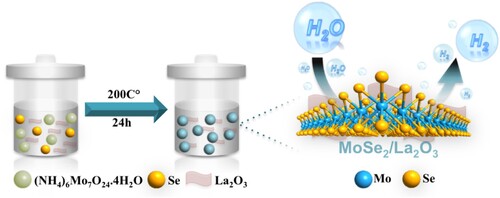
Figure 2. (a) XRD patterns; (b) Raman spectra of pure MoSe2, La2O3, and hybrid M-L2.
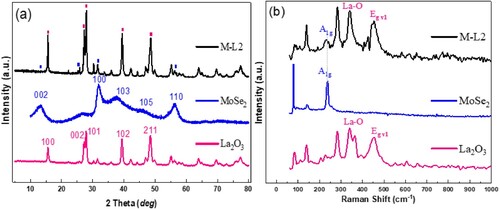
Figure 3. FESEM images of produced products at different magnifications: (a, b) pristine La2O3, (c, d) Pure MoSe2, and (e, f) M-L2 nanohybrid.
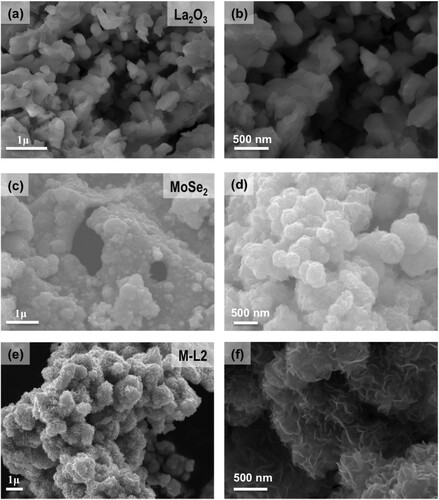
Figure 4. (a) EDX spectrum of the as prepared M-L2 sample. (b) SEM mage of elemental mapping. (c–f) EDX elemental mapping of La, O, Mo, and Se, respectively. (g) TEM image and (h and i) HRTEM along with magnified view of lattice plane of as prepared M-L2 sample.
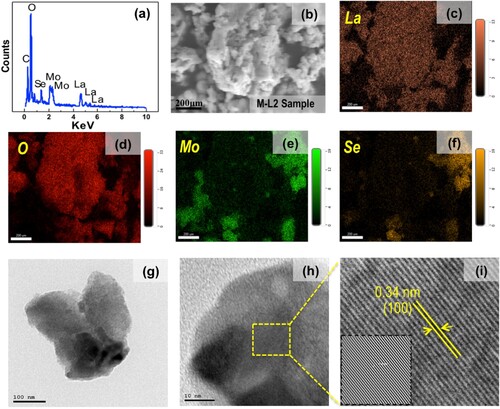
Figure 5. XPS results of pristine MoSe2, La2O3, and an M-L2 nanocomposite sample. (a) Scan spectra for the three materials. High-resolution XPS spectra of (b) La 3d, (c) O 1s, (d) Mo 3d, and (e) Se 3d.
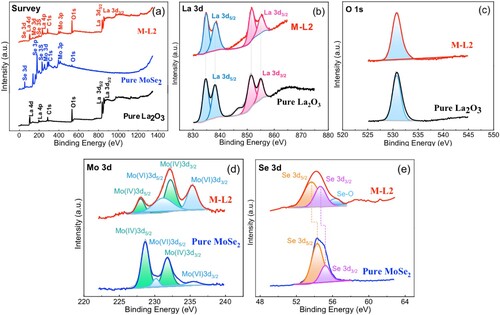
Figure 6. (a) LSV polarisation curves. (b) The corresponding Tafel plots obtained from polarisation curves for the bare carbon, MoSe2, La2O3, M-L1, M-L2 and M-L3.
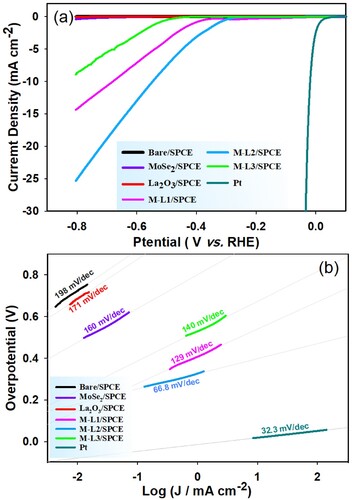
Table 1. A comparison of HER catalytic performance of MoSe2 materials.
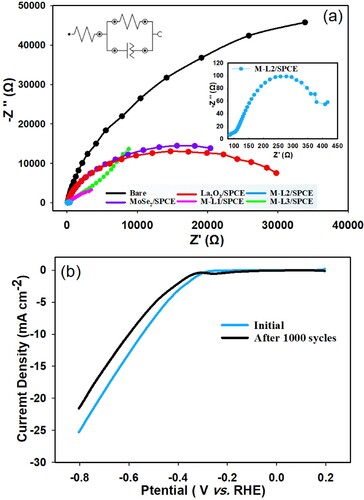
Figure 7. (a) Electrochemical impedance spectra of the bare carbon, MoSe2, La2O3, M-L1, M-L2 and M-L3. (b) Stability results for the M-L2 sample before and after 1000 CV cycles in 0.5 M H2SO4 under N2 atmosphere.