
Figures & data
Figure 1. The observed and modeled skin microfilarial dynamics following a single dose of: (a) ivermectin (150 µg/kg) and (b) moxidectin (8 mg)
The data points (from the phase II clinical trial conducted by [Citation16]) represent the percentage from pre-treatment mean microfilarial (mf) load (four skin snips from each participant) at 8 days and 1, 3, 6, 12, and 18 months after treatment for: (a) 45 ivermectin-treated participants (black triangles); (b) 38 moxidectin-treated participants (black diamonds). By way of model validation, the blue solid line in (a) illustrates the dynamics derived from the equations and parameters presented in [Citation9] rather than re-fitted to the data in [Citation16]. The red solid line in (b) represents the use of the modeling framework of [Citation9] to fit the data in [Citation16]. Error bars show the 95% CIs around the proportional reduction in mean mf counts, illustrating their variability among participants in the two trial arms depicted here. The data points at 8 days and 1, 3, and 6 months post-8 mg moxidectin are narrower than the plotted data and so are not discernible. To enable better visualization of post-treatment data points, the y-axis has been plotted from 0% to 30% (in both panels, the percentage at pre-treatment would be 100%). This figure has been reproduced under the Creative Commons Attribution 4.0 International License (CC BY 4.0) from [Citation45].
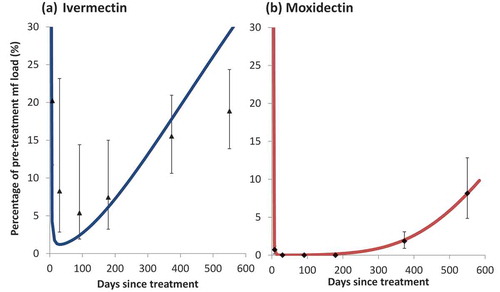
Table 1. Summary of adverse events (as a percentage of participants with AEs or SAEs) for ivermectin and moxidectin from phase II and III clinical trials
Table 2. Summary of efficacy on Onchocerca volvulus microfilariae for ivermectin and moxidectin from phase II and III clinical trials
Table 3. Characteristics of ivermectin, moxidectin, and doxycycline