
Figures & data
Figure 1. Monthly hospital-onset, healthcare-associated (HOHA) incidence (thick line, no. Of cases/1000 OBD) versus use of fluoroquinolones (thin line, DDD/1000 OBD), January 2015 to December 2021.
Figure 2. Monthly hospital-onset, healthcare-associated (HOHA) incidence (thick line, no. Of cases/1000 OBD) versus use of piperacillin-tazobactam (thin line, DDD/1000 OBD), January 2015 to December 2021.
Figure 3. The empirical cumulative distribution function for hospital-onset, healthcare-associated (HOHA) CDI historical data. The solid vertical line represents the 85th percentile (0.2645 cases/1000 OBD).
Figure 4. Receiver operator characteristic (ROC) chart showing the true positive classification rate against the false positive classification rate at different probability cutoff thresholds. The area under the curve (AUC) is an aggregate measure of performance across all possible classification thresholds.
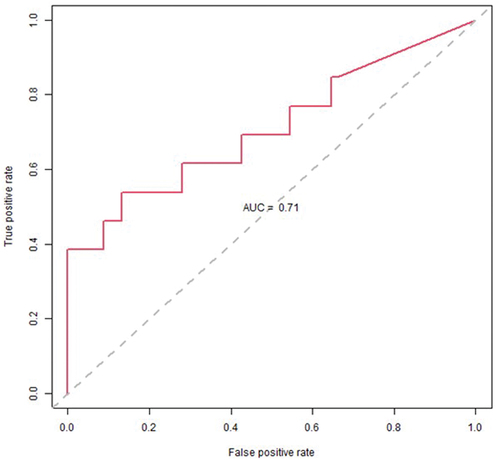
Figure 5. The cumulative CDI incidence rates relative to fluoroquinolone and piperacillin-tazobactam use being above or below their respective thresholds.
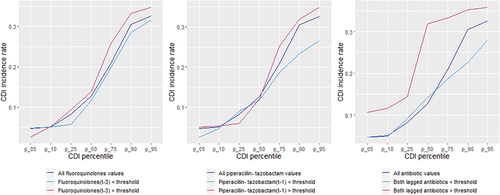
Table 1. Threshold logistic results in modeling hospital-onset, healthcare-associated (HOHA) CDI incidence rate at the 85th percentile, January 2015 to December 2021.
Table 2. Risk scores for CDI incidence rate exceeding the 85th percentile for 2020 and 2021.
Table 3. What-if threshold logistic model exploration.
Table 4. HOHA CDI incidence rate distribution when antibiotic use is below/above thresholds.
Table 5. Estimated reduction in the number of cases of studied pathogens.