
Figures & data
Figure 1. Analytical pathways of MRM (top) versus PRM (bottom). The crucial difference is that in MRM only selected fragment ions are monitored, while in PRM all fragment ions are monitored, out of which during data analysis the best performing fragment ions are used for quantification.
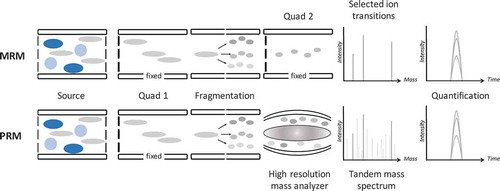
Figure 2. Example of the analysis of protein glycosylation patterns from large immunoglobulin A glycopeptides using high resolution MALDI-FTICR MS. An in-house example of a MALDI-FTICR mass spectrum that was used for the simultaneous analysis of N- and O-glycopeptides from serum IgA [Citation63]. Relative intensities are plotted in the y-direction (arbitrary units). Panel a shows the major part of the profile. Panels b and c exemplify the benefits of ultrahigh resolution. Here, symbols are used to indicate isotopic peaks that belong to the same species (i.e., measurand). In panel B four different species are clearly resolved (filled squares, open circles, stars and small triangles), whereas in panel c two different species are perfectly resolved (filled squares and stars). The isotopic distribution of species with near nominal mass are resolved as a result of the ultrahigh resolving power, and moreover, glycopeptides could be confidently assigned using the accurate masses.
![Figure 2. Example of the analysis of protein glycosylation patterns from large immunoglobulin A glycopeptides using high resolution MALDI-FTICR MS. An in-house example of a MALDI-FTICR mass spectrum that was used for the simultaneous analysis of N- and O-glycopeptides from serum IgA [Citation63]. Relative intensities are plotted in the y-direction (arbitrary units). Panel a shows the major part of the profile. Panels b and c exemplify the benefits of ultrahigh resolution. Here, symbols are used to indicate isotopic peaks that belong to the same species (i.e., measurand). In panel B four different species are clearly resolved (filled squares, open circles, stars and small triangles), whereas in panel c two different species are perfectly resolved (filled squares and stars). The isotopic distribution of species with near nominal mass are resolved as a result of the ultrahigh resolving power, and moreover, glycopeptides could be confidently assigned using the accurate masses.](/cms/asset/041d3947-f820-492f-b494-6df75572b75d/ieru_a_1253477_f0002_b.gif)
Table 1. Comparison between immunoassays and MS-based assays for protein quantitation, together with potential improvements that may be achieved by implementation of HRAM a.