3,651
Views
6
CrossRef citations to date
0
Altmetric
Review

Mass Spectrometry-based Biomarkers for Knee Osteoarthritis: A Systematic Review

, , , , &
Pages 693-706 | Received 29 May 2021, Accepted 05 Jul 2021, Published online: 09 Sep 2021

Figures & data

Figure 1. Frontal (left) and parasagittal (middle) view of the knee’s anatomy, as well as a visualization of the osteoarthritic knee (right) with osteoarthritic features such as synovial thickening, cartilage degradation and development of bone spurs. The bones in the human knee are covered by a layer of hyaline cartilage. This cartilage, in combination with the menisci and a layer of lubricating synovial fluid, facilitate the movement of the knee. Other tissues such as synovium and Hoffa’s fat pad are there to maintain joint homeostasis. Image was modified with permission from Servier Medical Art, licensed under a Creative Common Attribution 3.0 Generic License. http://smart.servier.com/

Figure 1. Frontal (left) and parasagittal (middle) view of the knee’s anatomy, as well as a visualization of the osteoarthritic knee (right) with osteoarthritic features such as synovial thickening, cartilage degradation and development of bone spurs. The bones in the human knee are covered by a layer of hyaline cartilage. This cartilage, in combination with the menisci and a layer of lubricating synovial fluid, facilitate the movement of the knee. Other tissues such as synovium and Hoffa’s fat pad are there to maintain joint homeostasis. Image was modified with permission from Servier Medical Art, licensed under a Creative Common Attribution 3.0 Generic License. http://smart.servier.com/

Table 1. Data extraction and study characteristics of selected articles: proteins analyzed in synovial fluid, cartilage, synovium or meniscus, sorted on tissue type and mass spectrometry method

Table 2. Data extraction and study characteristics of selected articles analyzing metabolites and lipids in synovial fluid and cartilage

Figure 2. Prisma flow diagram, screened abstracts and articles. A total of 32 and 24 articles were used for qualitative and quantitative analysis respectively in this systematic review

Figure 2. Prisma flow diagram, screened abstracts and articles. A total of 32 and 24 articles were used for qualitative and quantitative analysis respectively in this systematic review

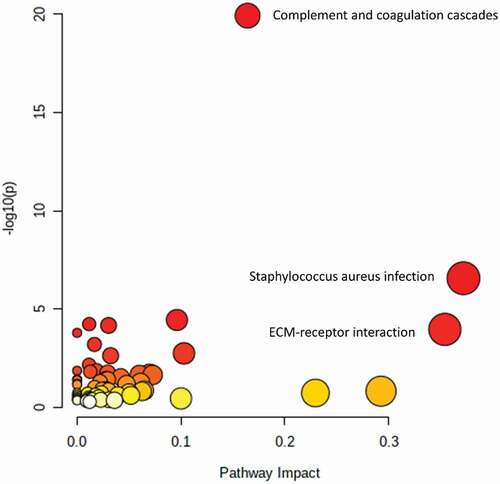
Table 3. Pathway analysis in MetaboAnalyst 5.0 using all upregulated-highlighted proteins (n = 35), lipids and metabolites (n = 13) in OA patients, found in the article search of this review. Pathways with high impact (impact > 0.1) are highlighted in bold. These pathways include complement and coagulation cascades, extracellular matrix receptor interaction and multiple inflammatory pathways

Figure 3. Upregulated proteins in cartilage, synovial fluid, synovium and meniscus of osteoarthritis patients, identified by at least two authors, without contradiction. Recurring proteins measured in at least three tissue types are highlighted in bold. Image was modified with permission from Servier Medical Art, licensed under a Creative Common Attribution 3.0 Generic License. http://smart.servier.com/

Figure 3. Upregulated proteins in cartilage, synovial fluid, synovium and meniscus of osteoarthritis patients, identified by at least two authors, without contradiction. Recurring proteins measured in at least three tissue types are highlighted in bold. Image was modified with permission from Servier Medical Art, licensed under a Creative Common Attribution 3.0 Generic License. http://smart.servier.com/

Figure 4. Upregulated metabolites and lipids in cartilage and synovial fluid osteoarthritis patients, identified by at least two authors, without contradiction. Lipid or metabolite species that were found in cartilage and synovium are highlighted in bold. Image was modified with permission from Servier Medical Art, licensed under a Creative Common Attribution 3.0 Generic License. http://smart.servier.com/

Figure 4. Upregulated metabolites and lipids in cartilage and synovial fluid osteoarthritis patients, identified by at least two authors, without contradiction. Lipid or metabolite species that were found in cartilage and synovium are highlighted in bold. Image was modified with permission from Servier Medical Art, licensed under a Creative Common Attribution 3.0 Generic License. http://smart.servier.com/

Figure 5. The Pathway Enrichment vs. -log10 (p) with p < 0.05 cutoff for proteins, lipids and metabolites in osteoarthritis patients. P-values are subdivided on a white to red color scheme, red indicating higher significance (P < 0.05). Circle size is determined based on Enrichment Ratio (ER), with small circles representing low ER and big circles representing high ER. ECM = extracellular matrix

Figure 5. The Pathway Enrichment vs. -log10 (p) with p < 0.05 cutoff for proteins, lipids and metabolites in osteoarthritis patients. P-values are subdivided on a white to red color scheme, red indicating higher significance (P < 0.05). Circle size is determined based on Enrichment Ratio (ER), with small circles representing low ER and big circles representing high ER. ECM = extracellular matrix
Supplemental material

Supplemental Material

Download MS Word (117.6 KB)