Figures & data
Table 1. Home languages of the children as reported by the educators.
Table 2. Reported language use in daily communication by the educators.
Figure 1. Comparison of the language use (expressed in percentages) of the educators and the children, as reported by the educators (N = 452, literacy questionnaire).
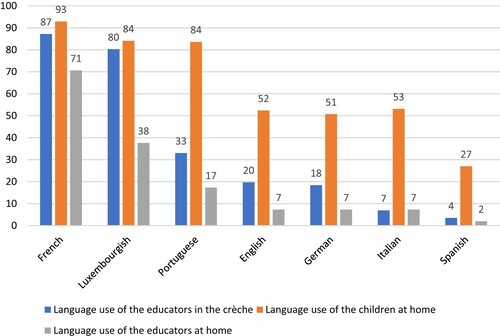
Figure 2. Reported language use (expressed in percentages) of the educators with the children according to the activity (N = 452, literacy questionnaire).
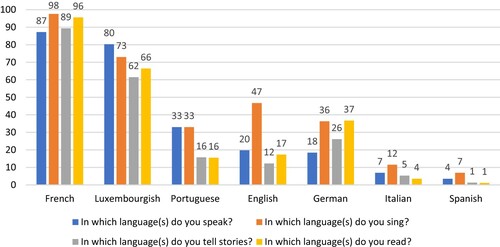
Figure 3. Parents’ language use (expressed in percentages) reported by educators (N = 289, collaboration questionnaire).
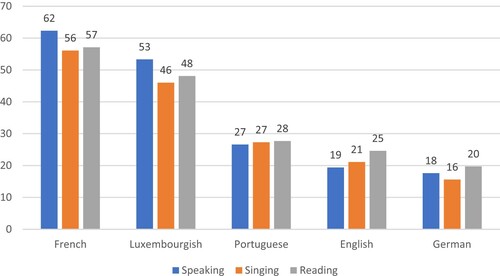
Figure 4. Parents use of the home language in collaborative activities (reported by educators and expressed in percentages) (N = 289, collaboration questionnaire).
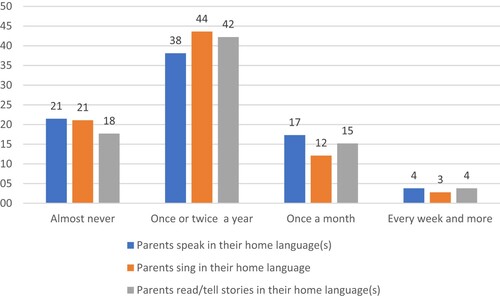
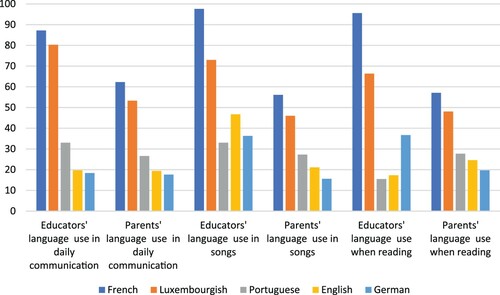
Figure 5. Reported language use (expressed in percentages) of educators (N = 452 literacy) and of parents (N = 289, collaboration questionnaire).