
Figures & data
Table 1. Demographic data.
Table 2. Weights for study participants.
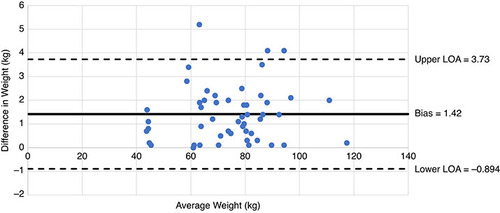
Figure 1. Bland–Altman plot for comparison of bed and standing scale weights. The X-axis represents the average weights of each bed and the standing scale weight pair. The Y-axis represents the weight differences between each bed and the standing scale weight pair.
LOA: Limit of agreement.
Supplemental material