
Figures & data
Figure 1. Forwarder Valmet 840.2. driving over a large obstacle
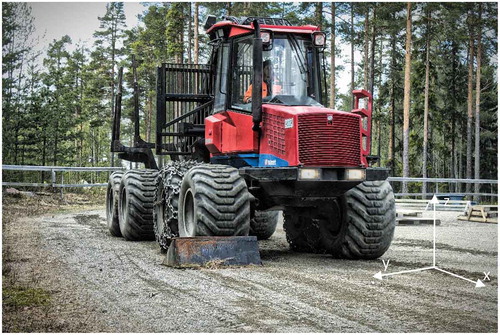
Figure 2. Dimensions of the steel obstacles for Course A: small, medium and large
Table 1. Linear mixed model (LMM) for Range of Motion (ROM [°]) divided for each direction when driving Course A (standardized obstacles). Number of observations = 720. The factors in this model are Obstacle, Wheels, Segment and Speed. Baseline is set to Obstacle (Large), Wheels on the forwarder (Rear) and Segment (Upper neck). Two-way interactions are not included. The covariate included was Speed. The mean speed during Course A was 3.3 km/h
Table 2. Mean Peak Acceleration [m/s2] for all drivers and repetitions measured at the seat and the head for x (sagittal), y (frontal) and z (vertical) directions provided separately for each obstacle of Course A and the whole course for Course B (terrain)
Table 3. Linear mixed model (LMM) for Angular Velocity Head (AngVel [°]) and Peak Acceleration (Acc [m/s2]) of the seat divided for each direction. Number of observations = 45. The factors in this model are Course and Speed. The baseline is set to driving on Course B (terrain). Deviations from baseline are presented for Course A (standardized obstacles) driving over the large obstacle with the front wheels. The covariate included was Speed
Table 4. Linear mixed model (LMM) for Range of Motion (ROM [°]) divided for each segment and direction. The factors in this model are Course and Speed. Number of observations = 45.The baseline is set to driving on Course B (the terrain course). Deviations from baseline are presented for Course A driving over the large obstacle with the front wheels. The covariate included was Speed
Figure 3. Illustrates the output of the sensor located on the driver’s seat when driving along Course A with 3 standardized obstacles, small, medium and large. The different directions are; X-Forward/Backward, Y-Sideways and Z-Vertical. The acceleration is measured in m/s2 and the time is presented in seconds
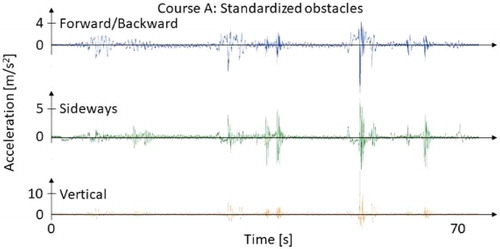
Figure 4. Illustrates the output of the sensor located on the driver’s seat when driving along Course B with natural obstacles. The different directions are; X-Forward/Backward, Y-Sideways and Z-Vertical. The acceleration is measured in m/s2 and the time is presented in seconds
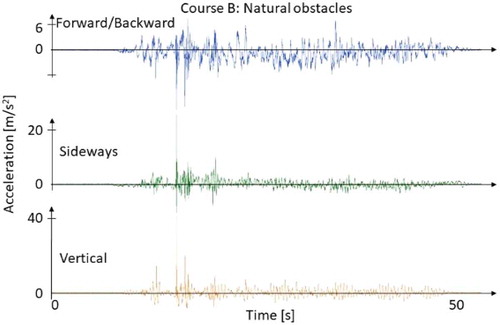
Table 5. The calculated Whole-body vibration values in each direction and the combined total sum for each driver. The values are presented as mean and standard deviation for the 3 repetitions on the terrain course. Bold values for Crest factor indicate that VDV values should preferably be used. Bold VDV values indicate that the action limit (9.1 m/s1.75) was exceeded