Figures & data
Figure 1. Nord-Aurdal and Etnedal municipalities in southern Norway (a), locations of study sites (b), and control measurements of stumps measured at site 8 (black dots) and coordinates measured by the harvester (white dots) (c)
Figure 2. The Komatsu 931XC harvester used in this study, and the industry standard system for positioning harvested stems. The black arrow indicates the machine's bearing, the white arrow indicates the direction of the crane, C indicates the crane angle with respect to the machine bearing, A indicates the angle between the inner and outer boom, ,
and
indicate the inner and outer boom and telescopic extension, respectively, and L indicates the crane length, as calculated by the on-board computer
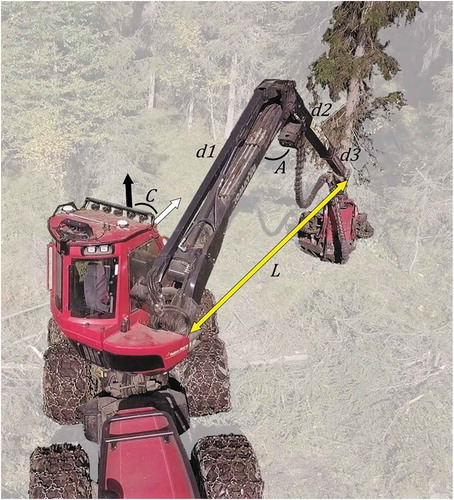
Figure 3. Overview of the modified system for positioning harvested stems used in this study. White circles indicate the differential GNSS antennas, the white arrow indicates the rotation calculated from the GNSS data and L indicates the crane length calculated by the on-board computer
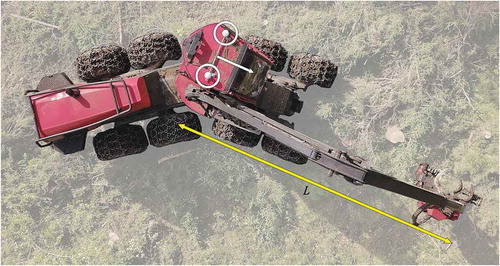
Table 1. Summary of harvester data
Figure 4. Density plot of positional errors obtained for the 285 harvested trees. The dashed line indicates the mean error of 0.88 m
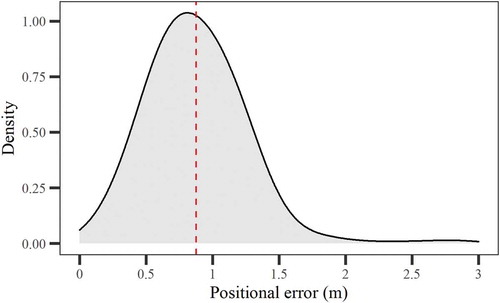
Figure 5. Ridgeline plot of positional errors obtained across sites. Labels indicate the month of data collection and number of observations, the dashed line indicates the mean error obtained for all sites combined
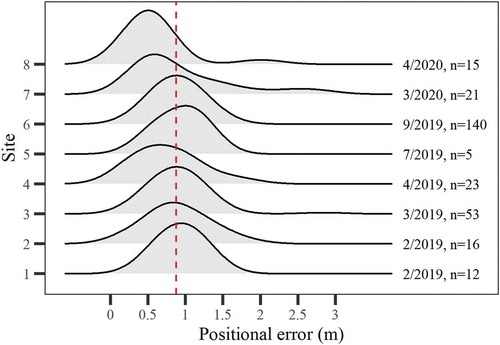
Figure 6. Positional errors plotted against values of horizontal dilution of precision, number of satellites, crane length and crane angle
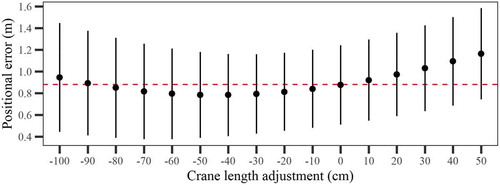
Figure 7. Mean positional errors of planimetric coordinates of harvested trees (dots) and standard deviations of the errors (whiskers) obtained for the adjusted values of crane length. The dashed line indicates the mean positional error without crane length adjustment