
Figures & data
Figure 1. The test set-up running the single (A) and double carriage (B)
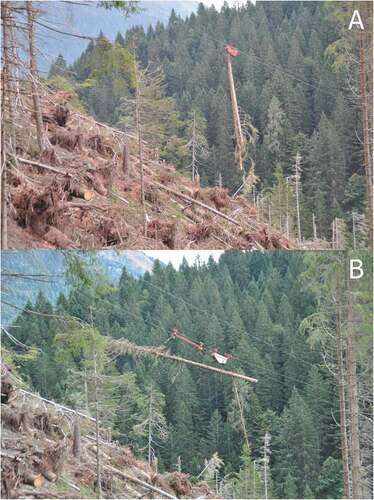
Figure 2. Examples of high-dynamic loading events. These can occur when loads get hung up on a stump or tree during inhaul or during the release of the carriage clamp under a load. Time on the x-axis refers to the duration of the respective yarding cycle, with the origin equaling the beginning of the cycle
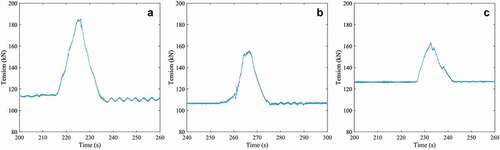
Figure 3. Example of observed tension during a complete yarding cycle, in which high-dynamic loading occurred, with selected work tasks (outhaul, breakout and inhaul) and waypoints (midspan, support) annotated. During phases in which the carriage was not moved (between outhaul and inhaul), e.g. lowering the dropline, connecting the chokers to the load, unloading or re-positioning of chokers after the high-dynamic load, tension varied only marginally. At the end of the cycle, tension dropped back to pre-tension level
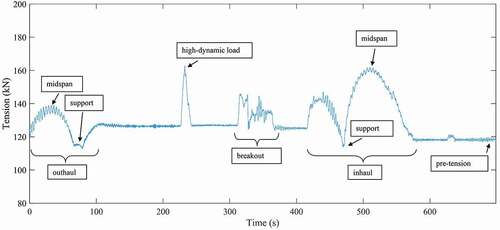
Table 1. Results of the Chi-square analysis for the frequency of events
Table 2. Skyline tension when carriage was at midspan
Table 3. Regression equations for predicting skyline tension when the carriage was at midspan and MCLA
Figure 4. Point scatter and regression graph for mean tension of the skyline when the carriage is at midspan (TMS). The graphs were calculated using the equation in , for the mean pre-tension of 109 kN for the double-hitch carriage and 103 kN for the single-hitch carriage
Table 4. Pre-tension, high-dynamic load, and maximum tension during breakout