Figures & data
Table 1. Input data for machine costs calculations.
Table 2. Input data for the region’s four districts, as used in the AH. In the DO, all stands were used irrespective of district borders. All mean values are volume weighted.
Table 3. Analysus results from the two approaches when only one machine type (the two-machine system (TMS)) was available.
Table 4. Relative distribution (%) of costs for the two approaches.
Table 5. Results from the analysis of the two approaches when two machine systems (TMS and harwarders) were competing.
Table 6. Cost distribution in percentage (%) for the two approaches.
Figure 1. Total costs when the harwarder productivity was adjusted from 95% to 105%.
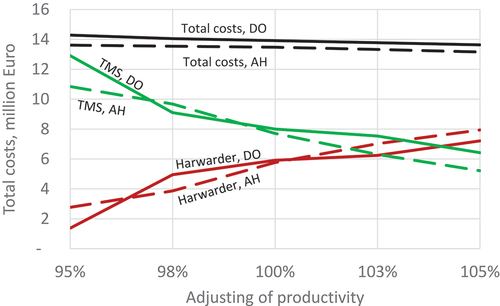
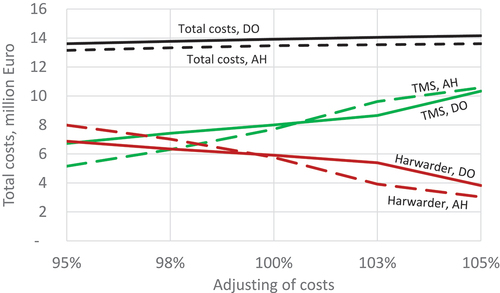
Figure 2. Total costs while the harwarder costs are adjusted from 95% to 105%.