Figures & data
Figure 1. The six core supply terminals and rail lines supplying mills in mid-Sweden. The two terminals to the left (Hoting, Krokom) are located in the interior zone, the remaining four are located in the mid-zone and the mills are situated along the eastern coastline.
Figure 2. Monthly transport pace (% of annual average) for mid-zone terminals by assortment 2019 -2020. The truck inflows are shown above and the rail outflows below, with the monthly change in sum terminal stocks in the middle (PW pulpwood, SL sawlogs).
Figure 3. Monthly transport pace (% of annual average) for interior zone terminals by assortment 2019 -2020. The truck inflows are shown above and the rail outflows below, with the monthly change in sum terminal stocks in the middle (PW pulpwood, SL sawlogs).
Figure 4. The monthly distributions of canceled and rescheduled routes for the 4 main causes of deviations from planned schedules.
Figure 5. General framework for rescheduling options on quarterly, monthly, weekly and daily horizons (R0 commercial railway operator, TA; Swedish transport authorities).
Table 1. Respondent specification of underlying causes for deviations from schedules (SCA; service buyer, RO; service provider).
Table 2. Mitigation scenarios developed after SCA/RO interviews with corresponding flow restrictions for wood flow.
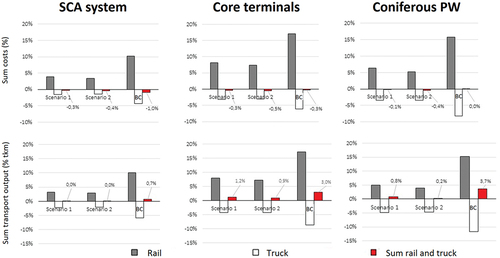
Figure 6. A comparison of relative costs and transport output between the base case and two scenarios for risk mitigation (Scenario 1 and 2) as well as an optimization of the base case (BC). The results from left to right provide 3 perspectives: in relation to the entire system (11 supply terminals), the core terminal (6 supply terminals closest to mills), or coniferous pulpwood flows, alone.