
Figures & data
Figure 1. Study area map showing new and previous harvest units.
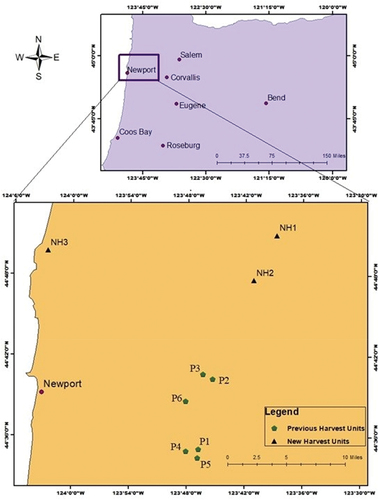
Table 1. Summary statistics of measured characteristic variables (new and previous harvest units).
Figure 2. Mean (red dot) and median slope (black line inside box) for different falling methods for new harvest units. The dark blue dots represent outliers.
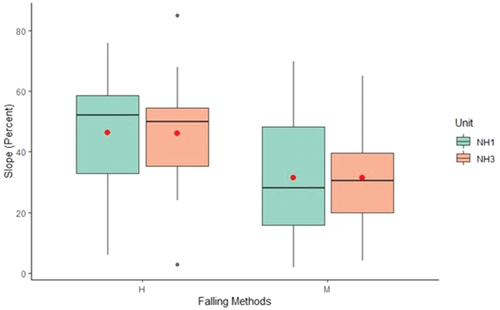
Table 2. Output statistics from logistic regression analysis (new and previous harvest units).
Figure 3. Boxplot showing mean (red dot) and median slope (black line inside box) for different falling methods for (top) aggregated data and (bottom) individual units [h: hand-felled & m: machine-felled] for previous harvest units. The dark blue dots represent outliers.
![Figure 3. Boxplot showing mean (red dot) and median slope (black line inside box) for different falling methods for (top) aggregated data and (bottom) individual units [h: hand-felled & m: machine-felled] for previous harvest units. The dark blue dots represent outliers.](/cms/asset/6f2e0c43-9724-4205-bc9f-03d7c971a876/tife_a_2170149_f0003_oc.jpg)
Figure 4. Timber-fallers perception about reasons for the need of hand falling in hand and machine mixed falling operations.
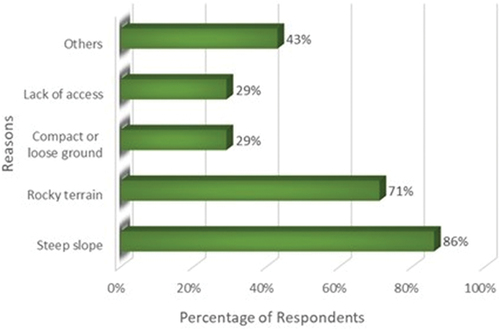
Table 3. Reasons for requiring hand falling for the study units.