Figures & data
Figure 1. Conceptual illustration of the different configurations of tele-extraction. “Teleload” was simulated in Lundbäck et al. (Citation2022) and Teledrives A and B were simulated in this study, with Full Auto as the ultimate reference point. The width of the box with each work element corresponds to the average productive machine hour (PMH) time for that work element as a share of the total PMH time per forwarder load according to Manner et al. (Citation2016). Red text indicates that the work element was teleoperated.
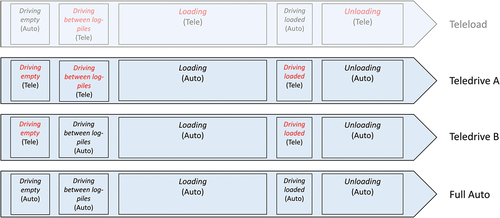
Figure 2. Approximate location and key figures of the harvest areas included in the study.
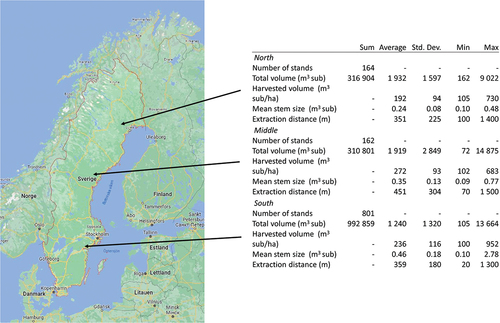
Figure 3. Illustration of the main work elements within forwarding in a teleoperation setting (drawings by Mikael Lundbäck, Ola Lindroos, and Skogforsk).
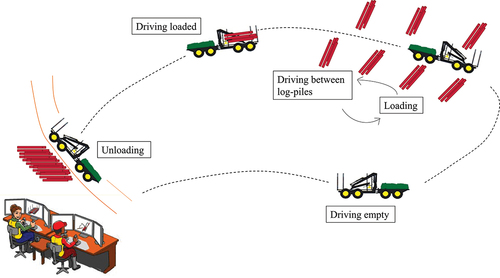
Table 1. Application of probability density functions and their parameters in the simulations (Lundbäck et al. Citation2022.).
Table 2. The variation of operator cost and time consumption for automated work elements parameters.
Table 3. Productivity (m3 sub/SMH) and cost (USD/m3 sub), average with standard deviation in parentheses and median with inter-quartile range (Q3–Q1) in parentheses, for Teledrive A (teleoperated driving between log piles) and Teledrive B at different number of operators on ten forwarders.
Figure 4. Average utilization of machines and operator pool for different number of operators (x-axis) and different configurations (Teledrive A and Teledrive B) with Full Auto as reference (*). North region.
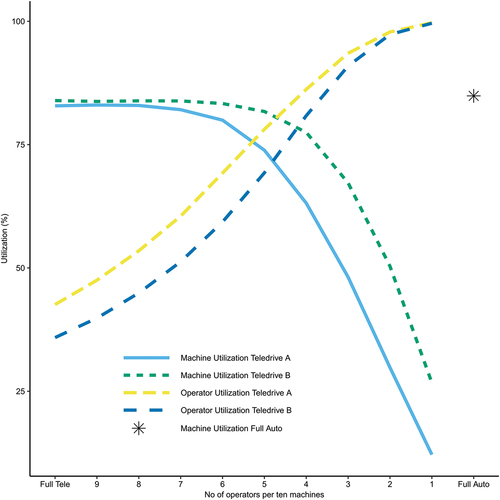
Figure 5. Average forwarder cost (USD/m3 sub) per cost category with varying number of teleoperators (x-axis) and different configurations (Teledrive A and Teledrive B) with Full Auto as reference. North region.
Figure 6. Simulated potential cost reductions for tele-extraction compared to standard forwarding, north region, with varying number of teleoperators (x-axis), relatively adjusted extraction distances, and different configurations (Teledrive A and Teledrive B) with Full Auto as reference (*). Most lines continue below the x-axis when number of operators decreases, spiking again for Full Auto (black stars).
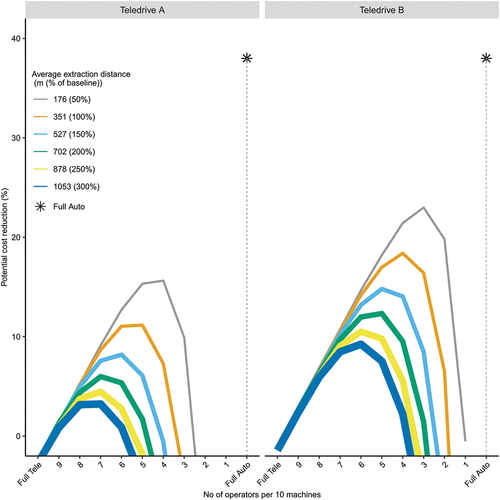
Figure 7. Sensitivity analyses of the parameters “Operator cost” and “Time consumption for automated work elements compared to their teleoperated equivalents”.
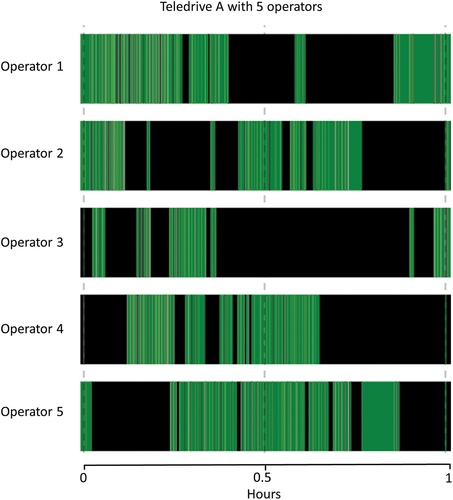
Figure 8. High-resolution visualization of a one-hour output of the Teledrive A simulation with five operators, black = busy and green = idle. The gray zones in the green areas indicate very short time windows for driving between log piles (operator busy) and loading (operator idle).