Figures & data
Table 1. Summary of surface soil moisture (SSM), soil water index (SWI) and NASA-USDA Enhanced SMAP Global soil moisture data (GSMD) products from ESA (European space agency) and NASA (National Aeronautics and Space Administration) satellite missions.
Figure 1. Examples of sampled forest road cross-sections, showing 5 m profile beam at left and measurement of e-module at right (Zorn ZPG 3.0 light-weight falling weight deflectometer). E-module was measured in each wheel track and on the uncompacted center line. Photos: Martin Bråthen.
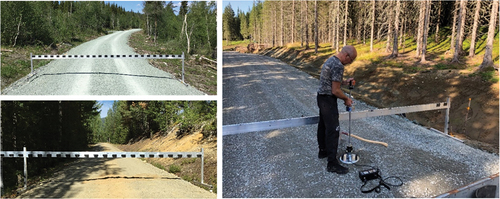
Table 2. List of abbreviations.
Table 3. The number of observations with DTW and SSM/SWI/SMAP data for the three surface deposit types.
Figure 2. Dendrogram for multivariate clustering of the respective weekly satellite-based soil moisture variables, according to their similarity (%).
Table 4. Mean road bearing capacity (e-module in MPa) per bearing layer material with the variability within each material class (Q1, Q2, CV).
Table 5. Ratios between in-situ measured volumetric soil moisture (VMC, %) and satellite-based soil moisture variables SSM, SWI and SMAP (mean, Q1–Q3). Road bearing layers of untreated surface deposits during the frost-free season.
Table 6. Mean e-module in road center line and wheel track (MPa) with their ratio (wheel track/center line) with variability in the wheel track (Q1, Q3). Road cross-sections of untreated surface deposits during the frost-free season.
Figure 3. Principal component analysis (PCA) loading diagram showing the covariation between road bearing capacity (e-module), surface deposit (SfcDep) permeability and satellite-based soil moisture variables (C-band: SSM, SWI;L-band: SMAP). Road cross-sections of untreated surface deposits during the frost-free season.
Figure 4. Box-plot of SWI soil moisture levels (Swi_sfc, SWI_sub) per permeability category (1=ocean/fjord sediment, 2=thick moraine, 3=glacio-fluvial). Post-transport registrations of untreated surface deposits during the frost-free season.
Table 7. An initial simple regression analysis comparing the effects of alternative soil moisture variables on road e-module (e-moduleroad in MPa, p < 0.05*, p < 0.01**, p< 0.001***). Road cross-sections of untreated surface deposits during the frost-free season.
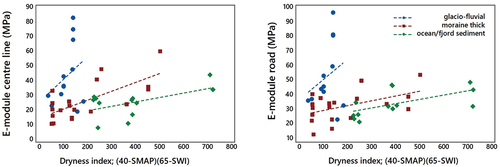
Figure 5. Scatter plots of e-module (MPa on y-axis) in relation to satellite-based soil dryness index (combined for SMAP and SWI on x-axis) for the three surface deposit types. (a) Uncompacted road center line (left), and (b) mean for road surface (right).