
Figures & data
Table 1. Variables that were extracted from each study and included in the database.
Table 2. Regional context, cultivation schemes and products reported by regional experts.
Table 3. Harvesting systems, productivity and costs ported by the regional experts.
Figure 1. Removal volume as a function of rotation length (Pi = pine, Eu = Eucalyptus, Po = Poplar, Ac = Acacia, Tk = Teak). Dots and grey lines represent the average value and the variation range between x and y axes, respectively. (Country codes in the figure: AUS = Australia, BRA = Brazil, CHN = China, ESP = Spain, ITA = Italy, MYS = Malaysia, PRT = Portugal, THA =Thailand, US = United States, ZAF = South Africa).
Figure 2. Individual stem volume as a function of rotation length (Pi = Pine, Eu = Eucalyptus, Po = Poplar, Ac = Acacia, Tk = Teak, Rb = Rubberwood). Dots and grey lines represent the average value and the variation range in the x and y axes, respectively. (Country codes in the figure: AUS = Australia, BRA = Brazil, CHN = China, ESP = Spain, ITA = Italy, MYS = Malaysia, PRT = Portugal, THA =Thailand, US = United States, ZAF = South Africa).
Figure 3. Harvester productivity in Eucalyptus (Eu), Pine (Pi), and Poplar (Po) plantations as a function of stem volume. Dots and grey lines represent the average value and the variation range in the x and y axes, respectively. (Country codes in the figure: AUS = Australia, BRA = Brazil, ITA = Italy, PRT = Portugal, ZAF = South Africa).
Figure 4. Feller-buncher productivity in Eucalyptus (Eu), Pine (Pi), and Poplar (Po) plantations as a function of stem volume. Dots and grey lines represent the average value and the variation range in the x and y axes, respectively. (Country codes in the figure: AUS = Australia, BRA = Brazil, ITA = Italy, US = United States, ZAF = South Africa).
Figure 5. Forwarder productivity as a function of removal volume per hectare (top) and extraction distance (bottom) in Eucalyptus (Eu), Pine (Pi), and Poplar (Po) plantations. Dots and grey lines represent the average value and the variation range in the x and y axes, respectively. (Country codes in the figure: AUS = Australia, BRA = Brazil, ESP = Spain, ITA = Italy, PRT = Portugal, ZAF = South Africa).
Figure 6. Skidder productivity in Eucalyptus (Eu), Pine (Pi), and Teak (Tk) plantations as a function of removal volume per hectare (top) and extraction distance (bottom). Dots and grey lines represent the average value and the variation range in the x and y axes, respectively. (Country codes in the figure: AUS = Australia, BRA = Brazil, THA =Thailand, US = United States, ZAF = South Africa).
Figure 7. Processor productivity in Eucalyptus (Eu), Pine (Pi), and Poplar (Po) plantations as a function of stem volume. Dots and grey lines represent the average value and the variation range in the x and y axes, respectively. (Country codes in the figure: AUS = Australia, BRA = Brazil, ESP = Spain, ITA = Italy, US = United States, ZAF = South Africa).
Figure 8. Productivity of motor-manual operations in Eucalyptus (Eu), Pine (Pi), Poplar (Po), Teak (Tk), and Rubberwood (Rb) plantations as a function of stem volume. (ZAF Pi = South Africa felling with chainsaw, ITA Po = Italy felling and processing with chainsaw, PRT Eu = Portugal felling with chainsaw, CHN Eu = China felling and processing with chainsaw and manual extraction, THA Eu = Thailand felling and processing with brush saw and extraction with farm tractor, THA Tk = Thailand felling with chainsaw, THA Rb = Thailand felling and processing with chainsaw). Dots and grey lines represent the average value and the variation range in the x and y axes, respectively.
Figure 9. Number of observations by harvesting system and study region.
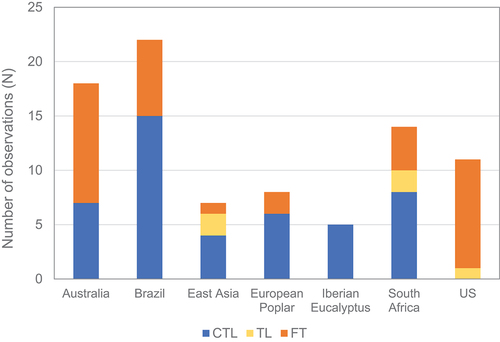
Figure 10. Regional harvesting costs at the roadside (felling, extraction to roadside, and stem processing) for the species included in the study (Eu = eucalyptus, Pi = Pine, Po = Poplar, Pa = Paraserianthes, Tk = Teak) during the period 2010–2020. Squares represent the average value; the grey lines are the cost variation ranges (min, max).
Figure 11. Cost breakdown by harvesting system (CTL, FT) and plantation type (Eu = Eucalyptus, Pi = Pine, Po = Poplar) in the study regions. Me = fully mechanized, Se = semi-mechanized.
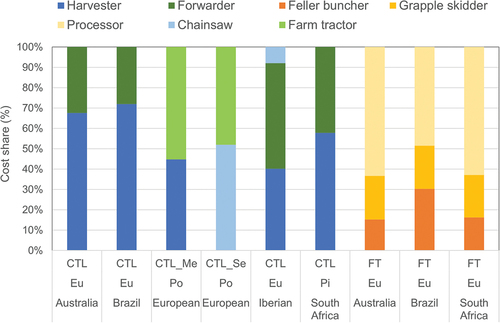
Table A1. Benchmarking plantation characteristics, harvesting systems, productivity, and costs across the different study regions.