
Figures & data
Figure 1. The outline of the algorithm for estimating the gripping position and orientation of a log.
Figure 2. Examples of labeled images.
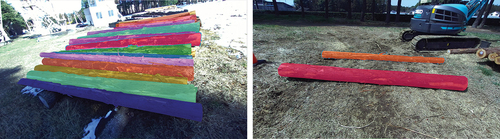
Figure 3. The outline of the estimated gripping position and evaluation axis in the log coordinate system.
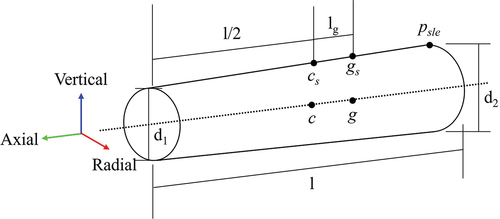
Figure 4. Experimental setup.
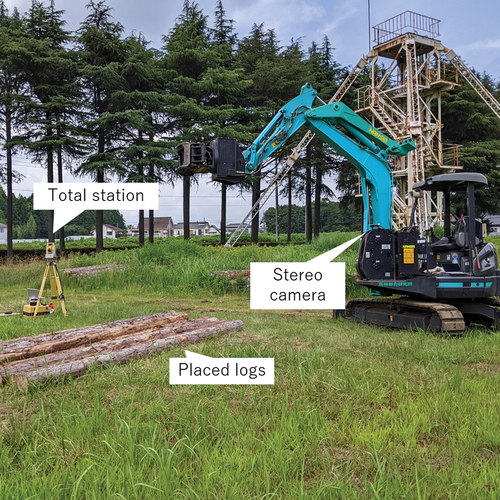
Figure 5. Trajectory of the machine chassis in the experiment by using simultaneous localization and mapping (SLAM).
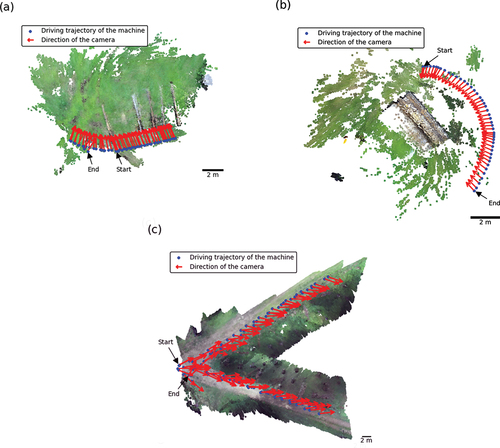
Table 1. Log-shape statistics.
Figure 6. A three-dimensional diagram of the grapple head.
Figure 7. Examples of log detection in the test dataset.
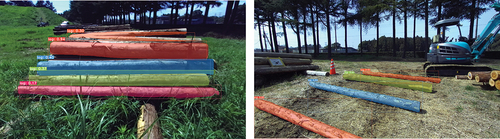
Figure 8. Examples of log detection during the experiments.
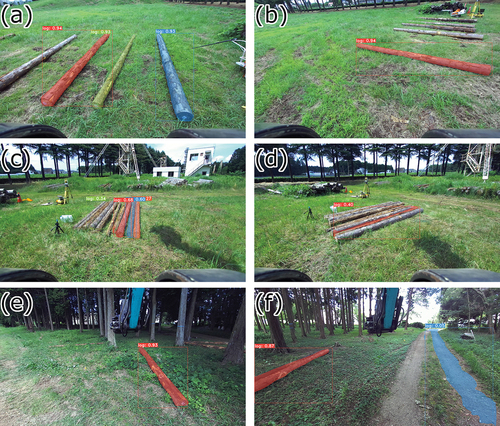
Figure 9. Estimated positions of gripping logs.
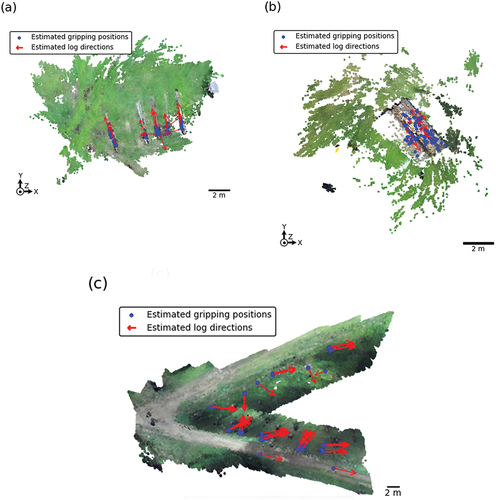
Figure 10. Estimated positions of gripping logs rotated through π/4 radians around the X-axis.
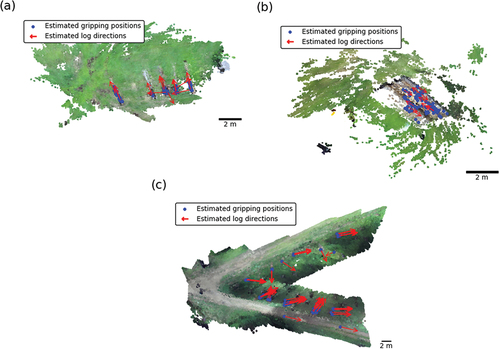
Figure 11. Estimated positions of gripping logs rotated through π/4 radians around the Y-axis.
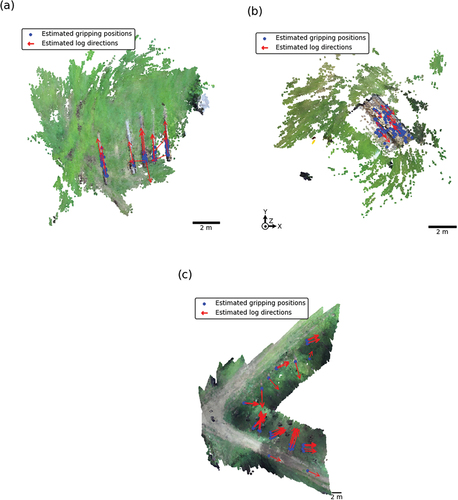
Table 2. Gripping position estimation results.
Table 3. Gripping orientation estimation results.
Figure 12. Evaluation outline of the log-camera rotational errors in the camera coordinate system.
Figure 13. The positional relations of the absolute rotational error between the X-axis of the camera and the log orientation around the Z-axis of the camera.
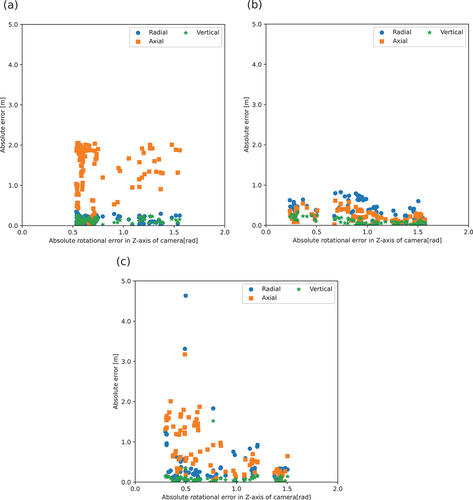
Figure 14. The orientational relations of absolute rotational error between the X-axis of the camera and the log orientation around the Z-axis of the camera.
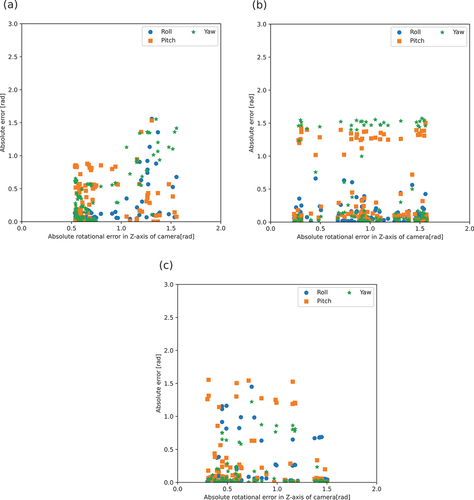
Figure 15. Points in the graspable range in each experiment.
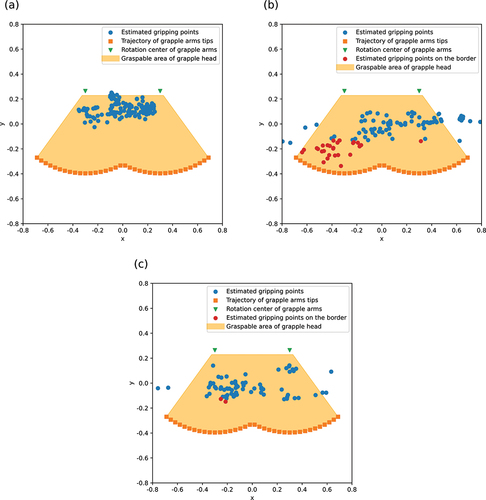
Table 4. Correlation coefficients.