Figures & data
Figure 1. The workflow for the calculation of minimum energy transportation cost using FEVER.
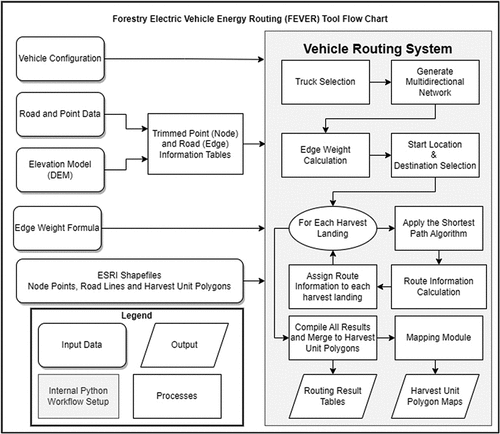
Table 1. Truck input parameters for the Edison Model R-500 – Tri-drive truck.
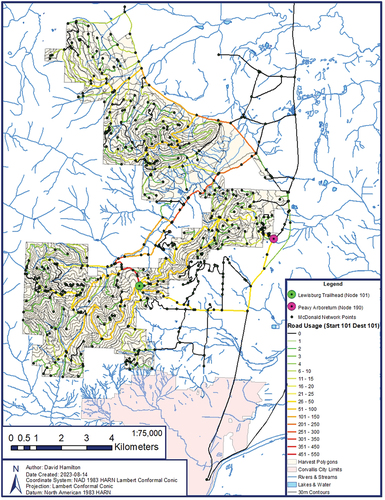
Figure 2. The McDonald Dunn research forest road networks, elevation contours, hauling origins and destinations.
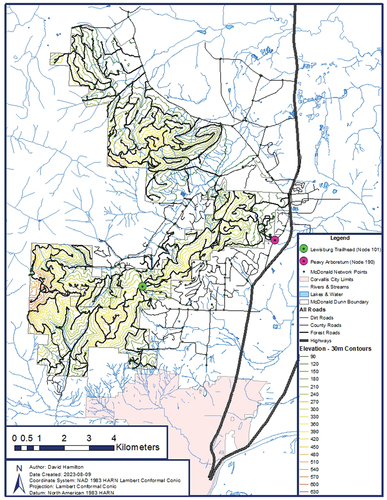
Figure 3. A multidirectional graph demonstrating the usage of alternate routes based on if a chip truck is loaded or unloaded. Routing is based on and edge weight energy calculations are based on EquationEq. 2(2)
(2) .
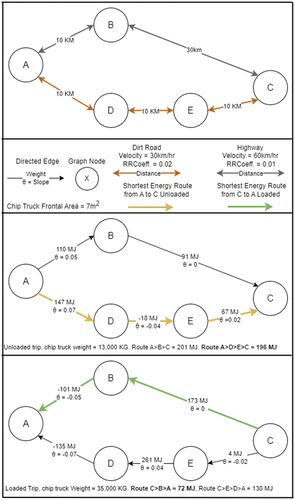
Table 2. Routing summary data*.
Figure 4. Harvest polygons colored based on total transportation cost (megajoules) for an empty R-500 - tandem traveling from the Lewisburg Trailhead (node 101) to the harvest polygon and then traveling back loaded to the Lewisburg Trailhead (node 101).
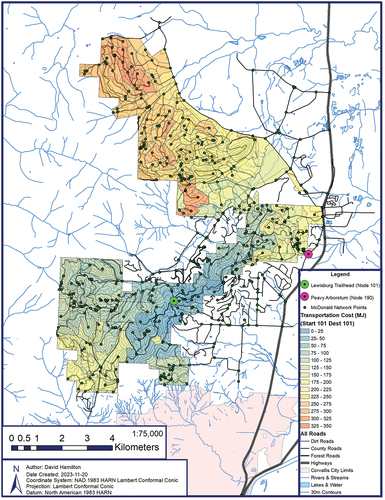
Figure 5. Harvest polygons colored based on total transportation cost (megajoules) for an empty R-500 - tandem traveling from the Peavy Arboretum (node 190) to the harvest polygon and then traveling back loaded to the Peavy Arboretum (node 190).
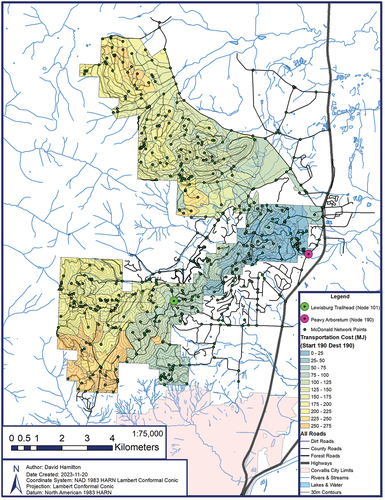
Figure 6. Harvest polygons colored based on total transportation cost (megajoules) for an empty R-500 - tandem traveling from the Lewisburg Trailhead (node 101) to the harvest polygon and then traveling back loaded to the Peavy Arboretum (node 190).
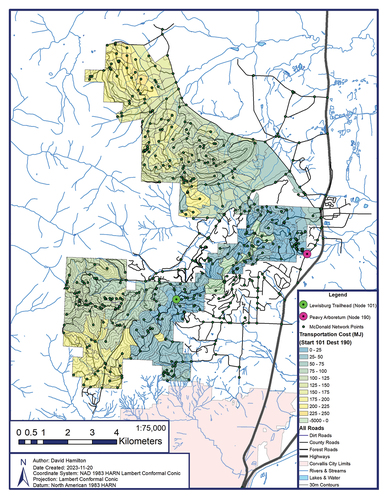
Figure 7. Harvest polygons colored based on total transportation cost (megajoules) for an empty R-500 - tandem traveling from the Peavy Arboretum (node 190) to the harvest polygon and then traveling back loaded to the Lewisburg Trailhead (node 101).
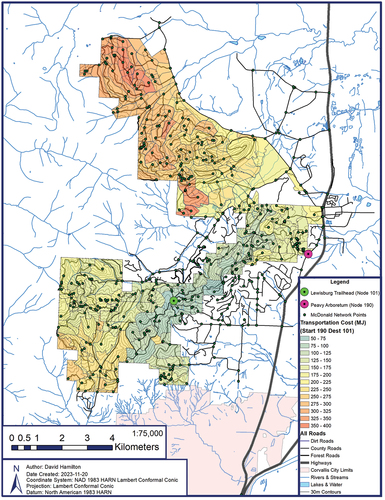
Figure 8. Harvest polygons colored based on total transportation cost as a function of distance (Kj/km) for an empty R-500 - tandem traveling from the Lewisburg Trailhead (node 101) to the harvest polygon and then traveling back loaded to the Lewisburg Trailhead (node 101).
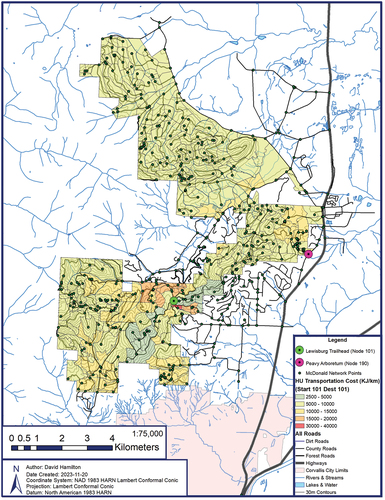
Figure 9. Harvest polygons colored based on total transportation cost as a function of distance (Kj/km) for an empty R-500 - tandem traveling from the Peavy Arboretum (node 190) to the harvest polygon and then traveling back loaded to the Peavy Arboretum (node 190).
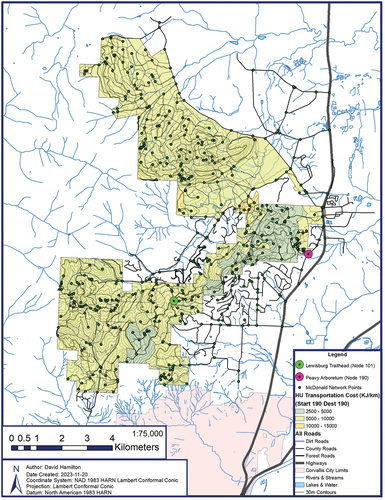
Figure 10. Forest roads colored based on the number of trucks that cross each road edge for every harvest landing on the trips from node 101 to node 101.